- Home
 Atmolytics
-
Apps
-
Identity check
-
Identity Check: report outputs
Identity Check: report outputs
An Identity Check report consists of three tabs of data. Each of these is explained below.
You can also create subgroups of data taken from the main Identity Check report. The Subgroups tab explains this feature.
Depending on the permissions assigned to you, you may be able to share reports with other users. See Report sharing for more information.
The basic output of an Identity Check report is a table with patient details listed in the left-hand columns and selected items from other forms alongside. The total number of patients included in the report is shown at the top:
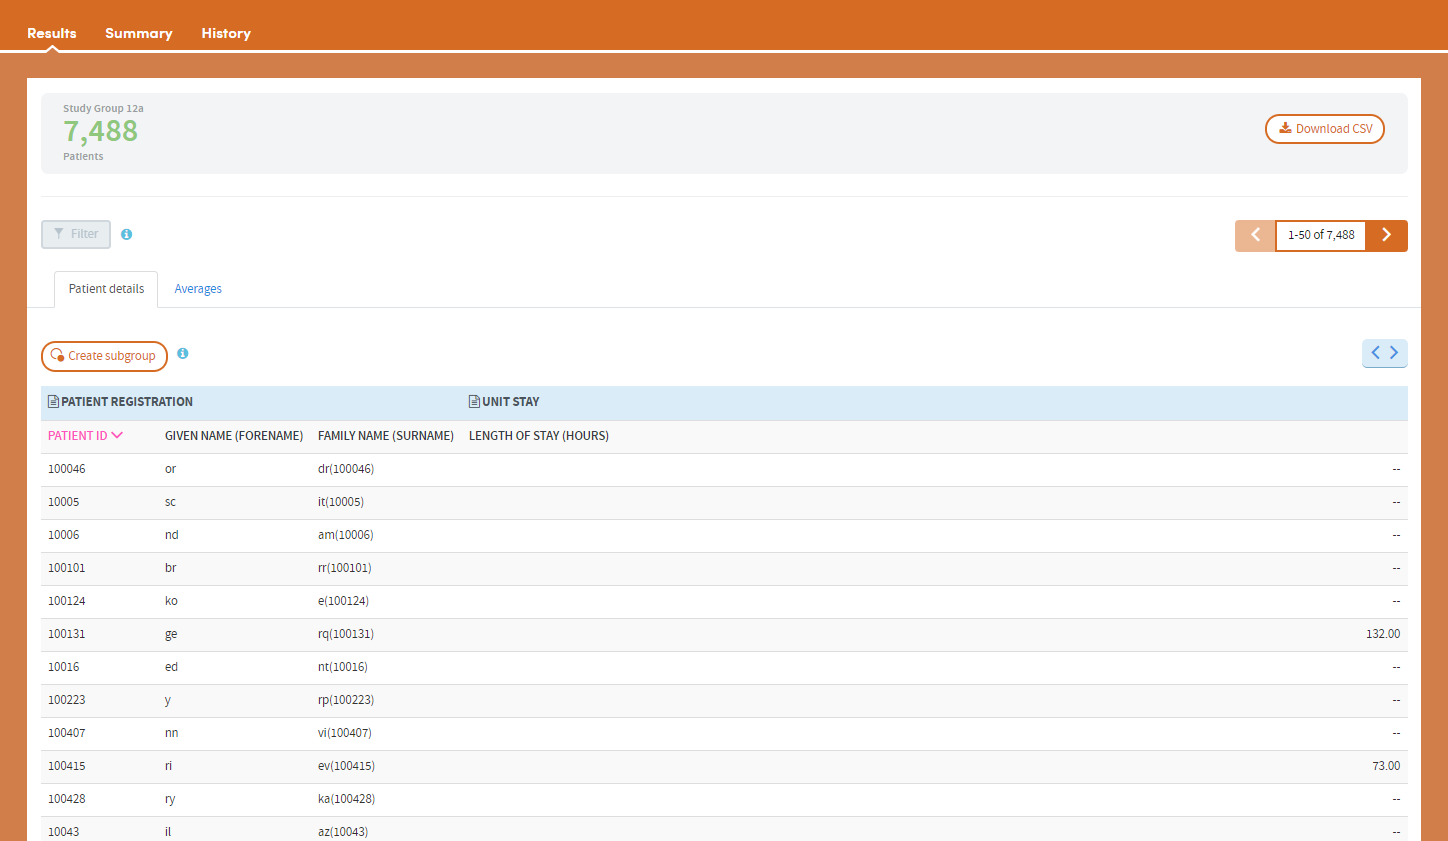
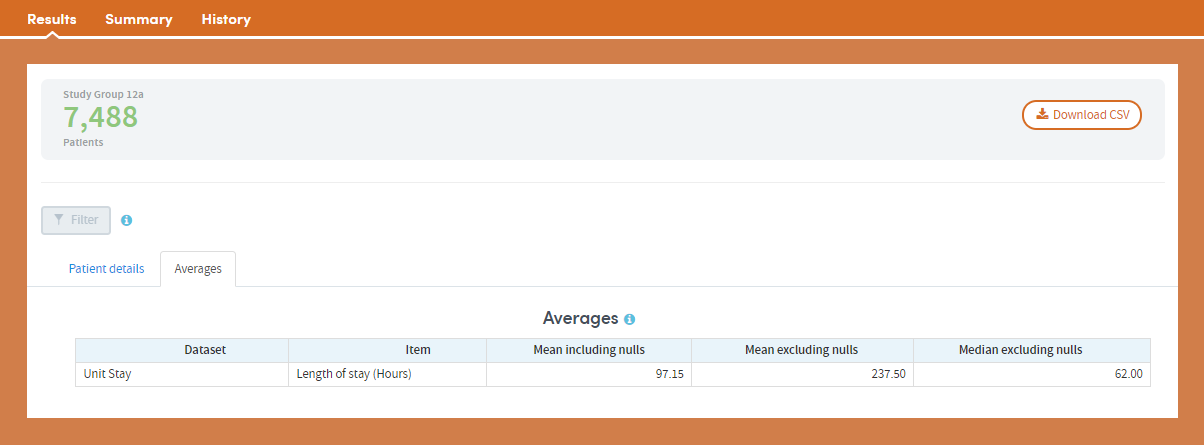
Additionally, an average score is generated for any data items that are numeric; for example, age, length of stay, blood pressure. These can be accessed by clicking the Averages tab:
Filtering report data
Your report can be filtered by any combination of answers recorded about data items with structured lists of answers; for example, gender or marital status. Click the Filter button towards the top left of the results page:
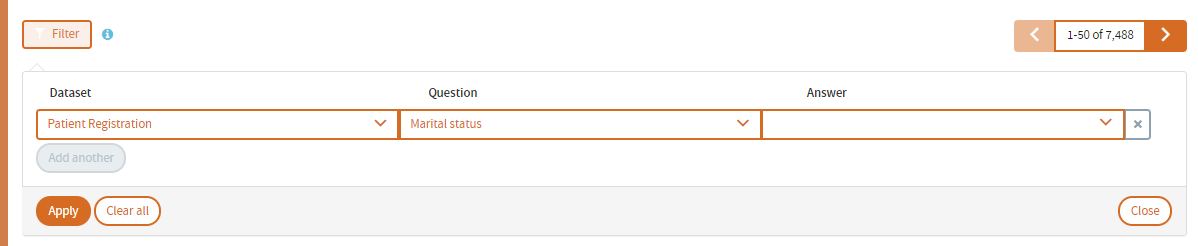
All the suitable filter items will be available to you here. Choose the dataset, question/item, and answer that you want to filter on, and click Apply.
The updated number of patients is also shown, once the selected filters have been applied. In the example below, filtering by marital status=single reduces the number of patients to 1,533:
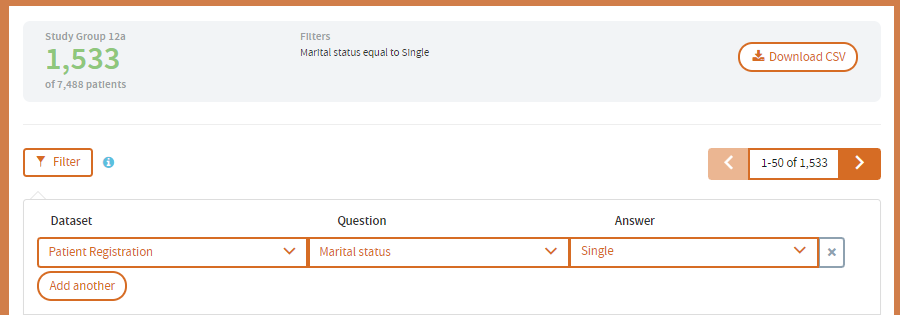
Click Add another to add a second filter. You can apply any number of filters. However, the rules applying to filtering should be noted (see below).
Example:
If you filter on marital status=single and gender=male, this will filter the list down to all patients who are single AND male, i.e. all single men.
If you select gender=male, marital status=single and also select marital status=widowed this will select all patients who are single OR widowed AND male, i.e. all men who are single or widowed.
This is what would be intuitively expected. However, note that the software is using the AND operator across two different questions; and the OR operator within single questions such as marital status. For example, you cannot select patients who are single AND widowed; you can only select patients who are single OR widowed.
Sort list
Listed patients may be sorted on any available column by selecting the column and clicking the pink arrow.
Download CSV
The full listing of patients produced by the report can also be downloaded as a .CSV file that can be opened directly into Excel by clicking the Download CSV button in the top right-hand corner of the screen.
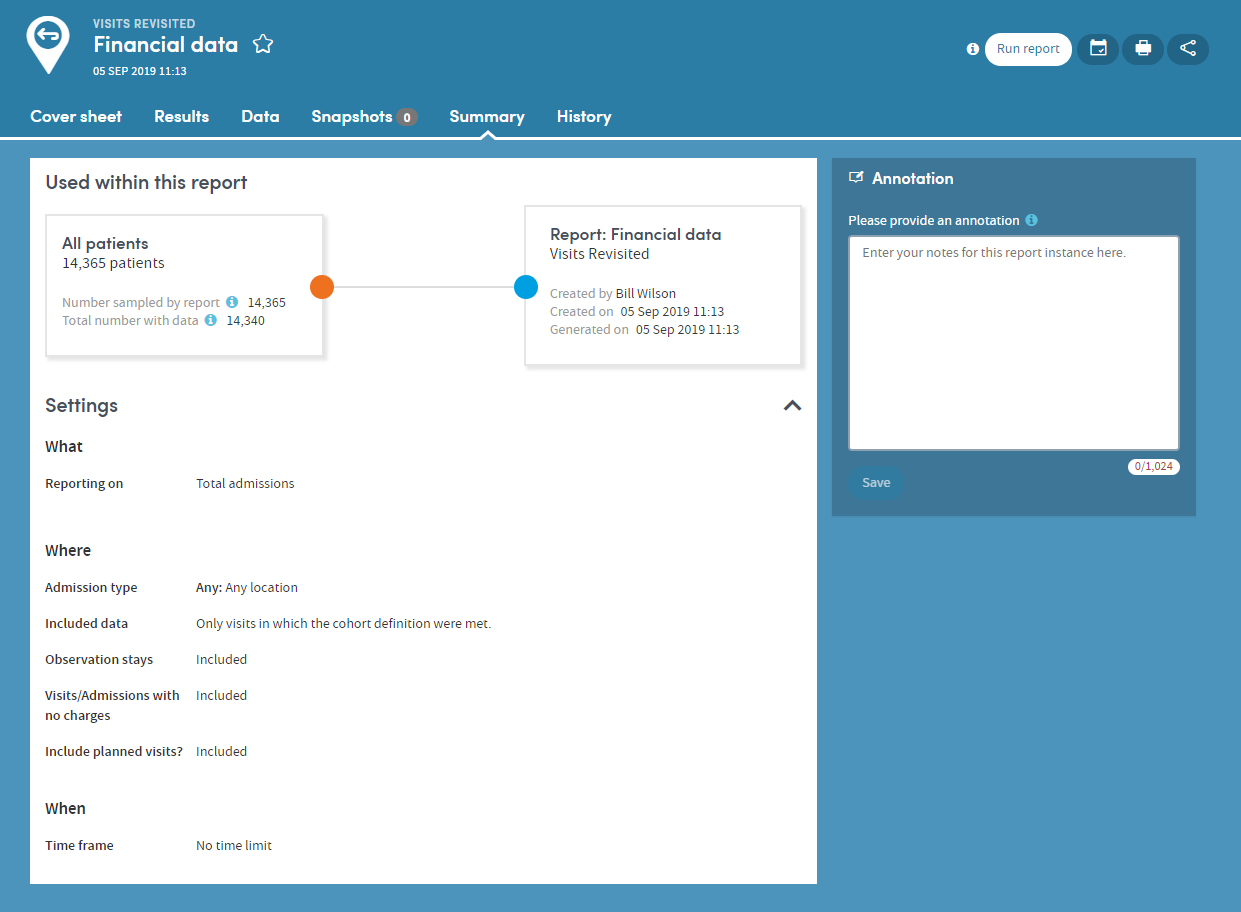
The Summary tab specifies all the options selected by the user who created the report. You can also add annotations to the Summary if you wish:
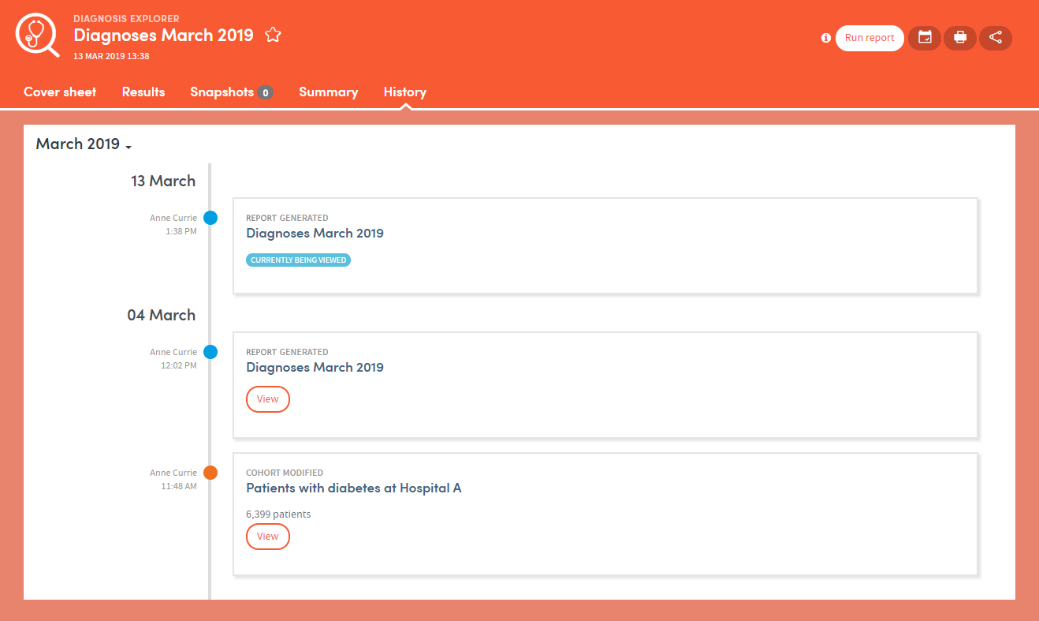
Every time a report is generated, it is saved and can be reviewed at any time. The History tab allows you to select and view any previous version of your report:
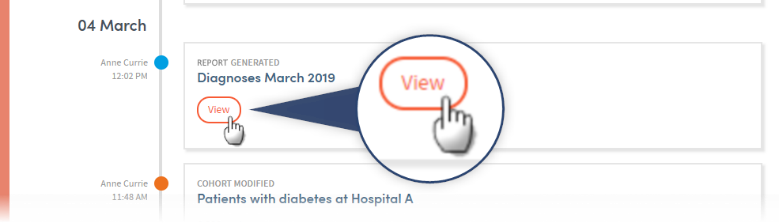
Click the View button to see previous versions of the report:
Some of the most frequently used Apps enable subgroups to be created within a report and saved as a new cohort. Identity Check is one of these Apps.
Subgroups are a special type of cohort. They are defined by the identities of the individuals who belong to the cohort rather than by the criteria that select those individuals. Because of this, subgroups are not editable in the way that standard cohort definitions are editable, since all that Atmolytics has available to it are the IDs of the individuals in the subgroup rather than a set of criteria that can easily be applied back with Cohort Discovery.
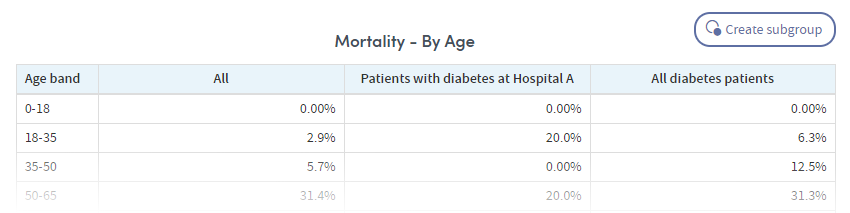
The Results tab of your report will display the Create subgroup button:
Click the button and choose the individuals you want to include by clicking the check boxes next to the data in the table. As you do so, the Subgroup description field will be populated with the relevant information. You can edit this description if you wish. You also need to complete the Subgroup name field.
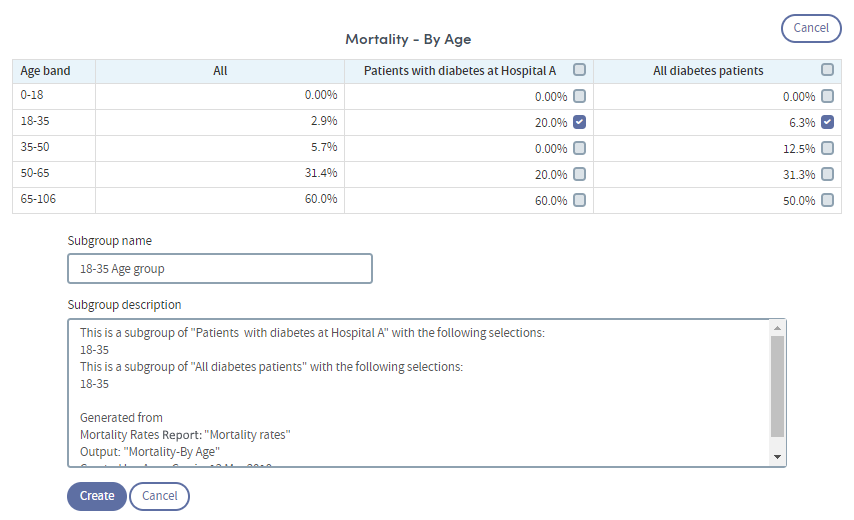
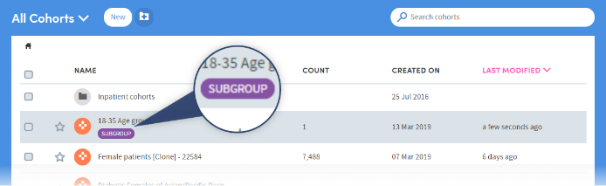
Click Create when you’re ready. The subgroup will be created. You’ll find the new cohort in the My Cohorts area, with a SUBGROUP tag under the cohort name:
Subgroups can be used in reports and (subject to user permissions), shared with other users.