- Home
 Atmolytics
-
Apps
-
Activity counter
-
Activity Counter: report outputs
Activity Counter: report outputs
An Activity Counter report consists of six tabs of data. Each of these is explained below.
You can also create subgroups of data taken from the main Activity Counter report. The Subgroups tab explains this feature.
Depending on the permissions assigned to you, you may be able to share reports with other users. See Report sharing for more information.
Every report output has a cover sheet which shows selections from the full report results. The cover sheet of an Activity Counter report displays up to four activities. Depending on your report criteria, the data displayed will include the following information for each cohort and activity you selected:
- The number and % of admissions/visits during which each activity was undertaken.
- The number and % of patients for whom each activity was undertaken.
- The total number of occasions each activity was undertaken.
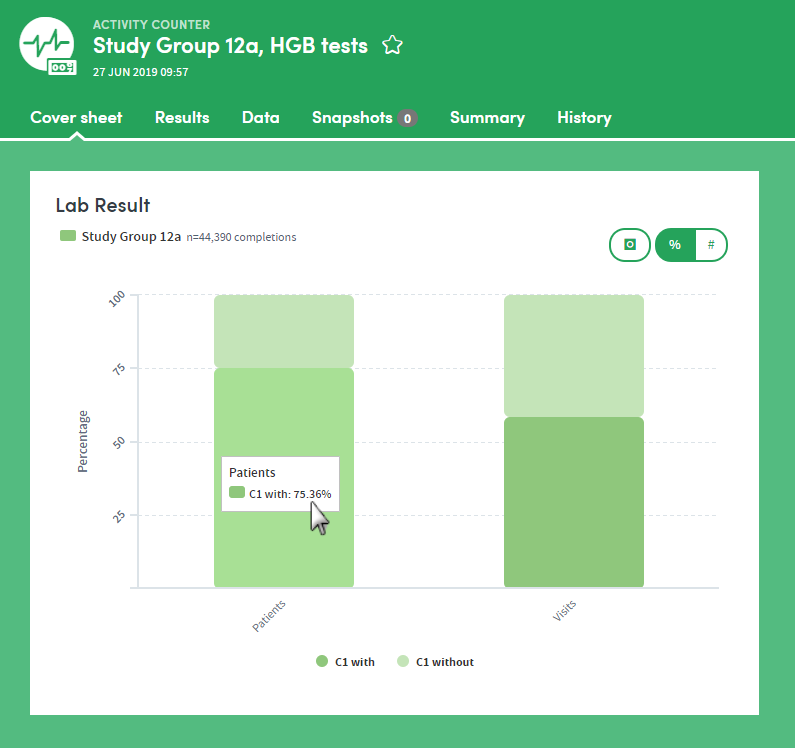
In this sample cover sheet, we can see that our cohort contains 44,390 completed HGB tests. By dwelling the mouse over the chart we can see that 75.36% of the patients in our cohort have HGB tests in their data. We can use the button on the top right to toggle between percentages and counts.
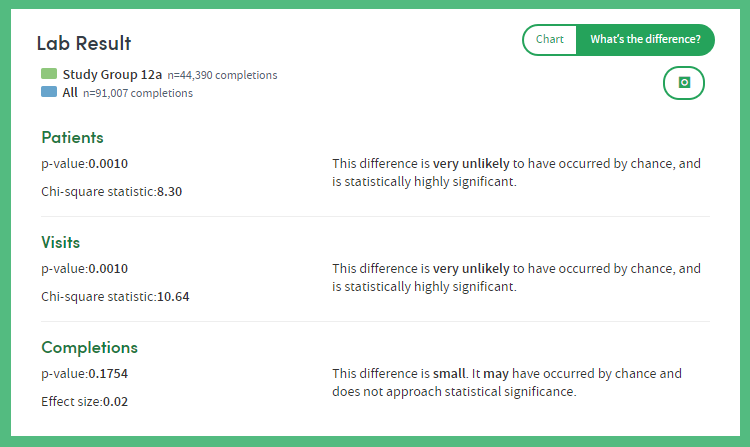
What’s the difference?
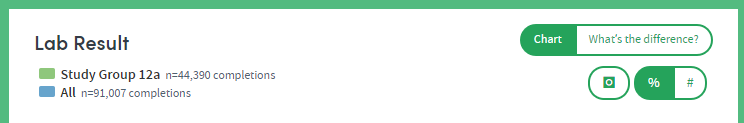
If two cohorts have been selected, clicking the What’s the difference? feature indicates whether there’s a statistically significant difference in the number of activities between the two cohorts:
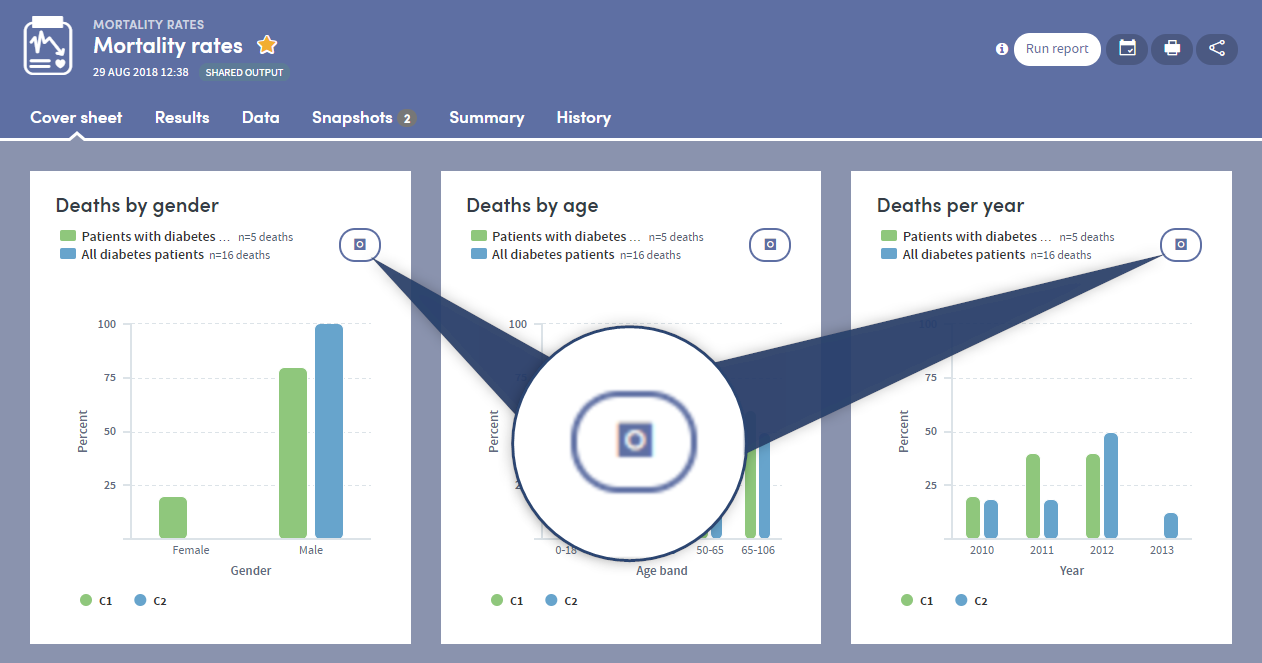
The Results tab allows you to browse the report data in great depth, on an item-by-item basis with both graphical and tabular representations where appropriate. You’ll find a range of interactive facilities designed to enable easy sorting and sifting of the data.
Depending on your report criteria, the data displayed will include the following information for each cohort and activity you selected:
Two bar charts are displayed: one depicting the proportion of patients for whom the activity either was or was not completed, and the other depicting the proportion of admissions/visits with and without that activity.
If two cohorts were selected during report creation, both charts will have two columns for each result; one for each cohort.
It is possible to toggle between display of counts and display of percentages. Click the Settings tab on the right-hand side to access these features.
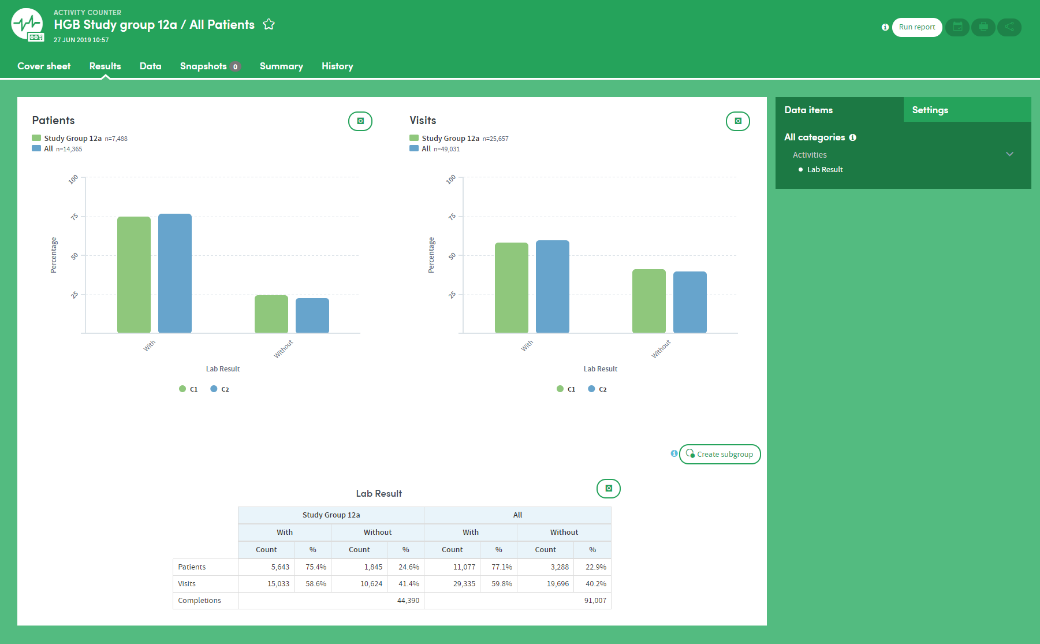
Data table
For each activity, the data table shows raw count data for that form, displaying results for the following counts:
- Number of occurrences of the activity
- Number of admissions/visits during which the activity was undertaken
- Number of patients for whom each activity was undertaken
The table also enables you to view the proportions of patients and visits with and without the activity.
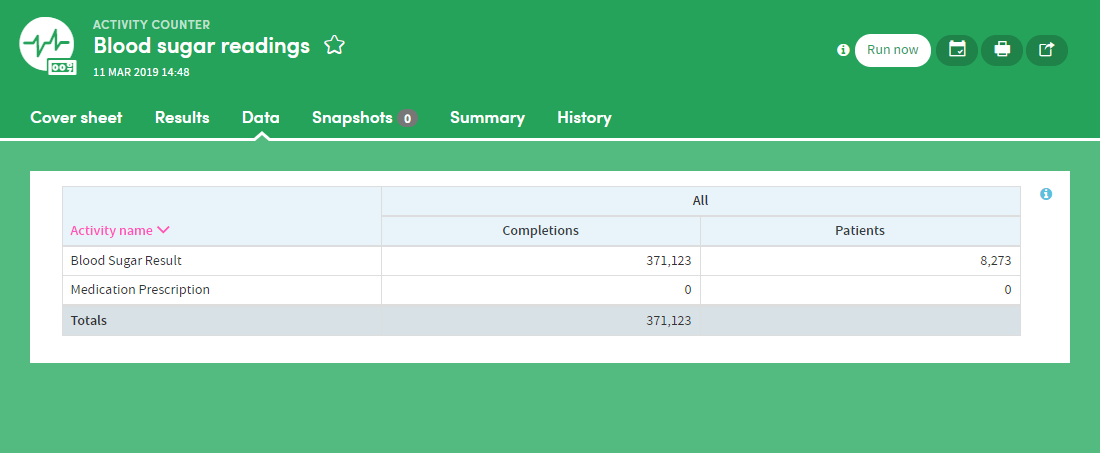
The Data section tab presents the report data in tabular format, with features which enable in-depth sorting and analysis
As well sharing report outputs, you can also take, share, and discuss ‘snapshots’ of your Atmolytics reports with other users, using a built-in chat room facility. At various places in the Cover sheet and Results tabs of your report, you’ll see a snapshot icon:
Click the icon to take a snapshot of that area of the report:
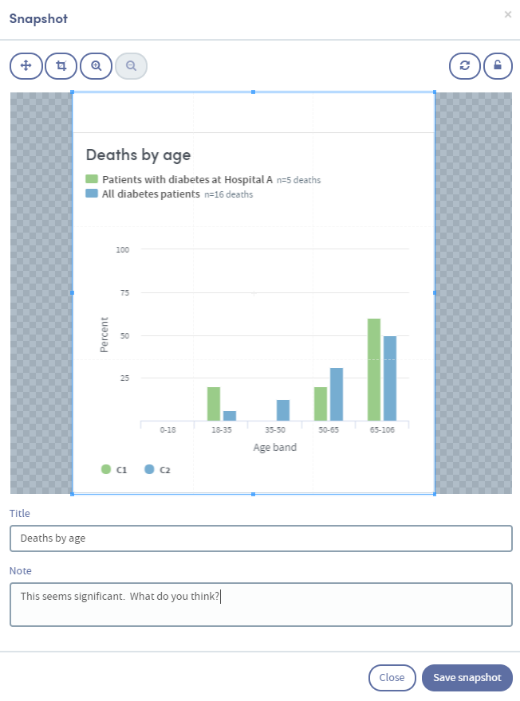
Add a title and an optional note, and click Save snapshot. Once the snapshot is saved, the image and comment are saved under the report’s snapshot tab:
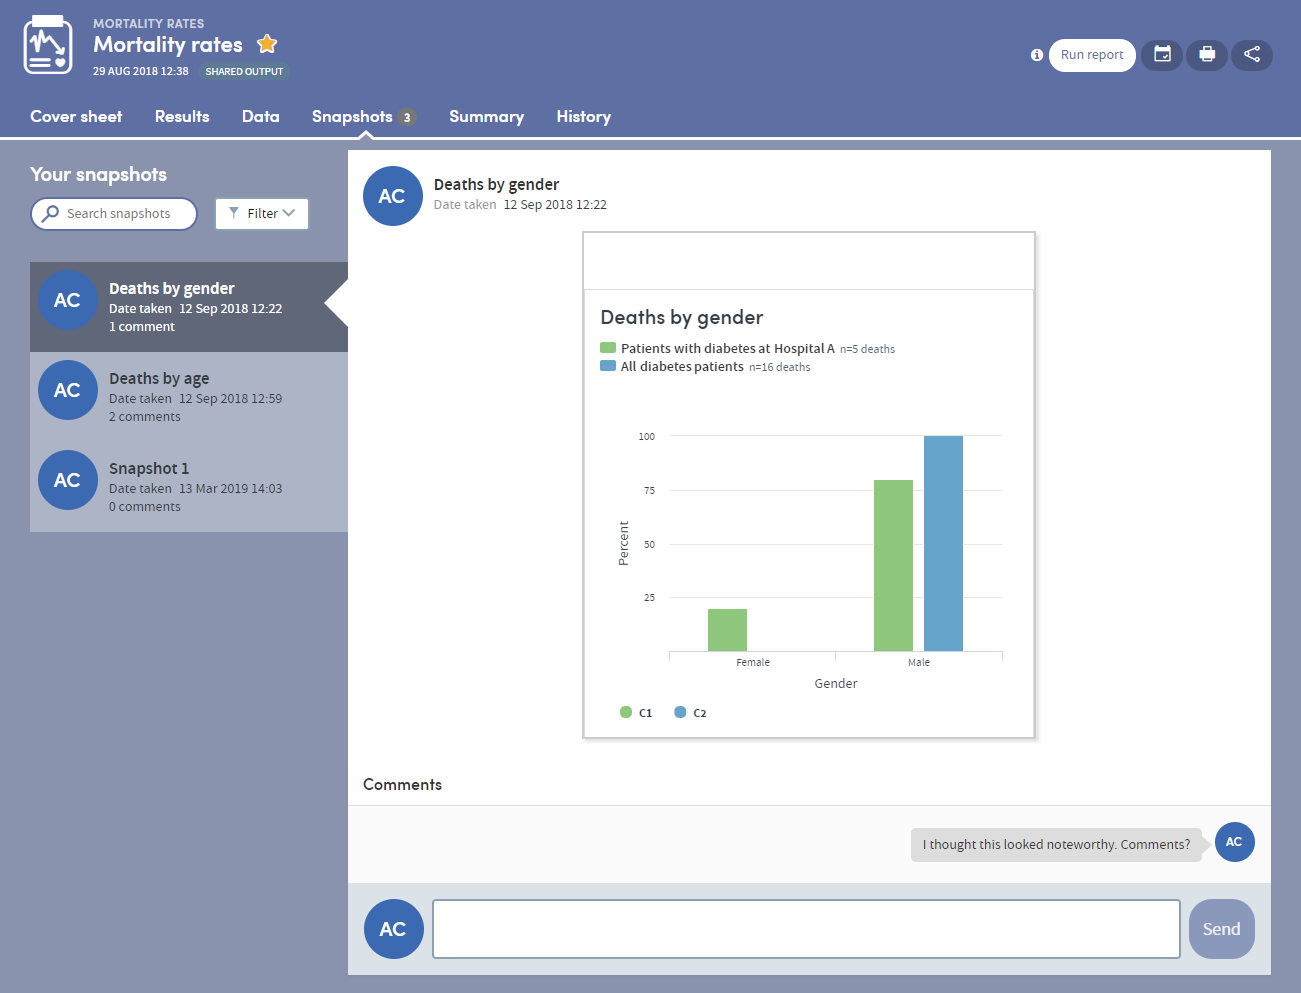
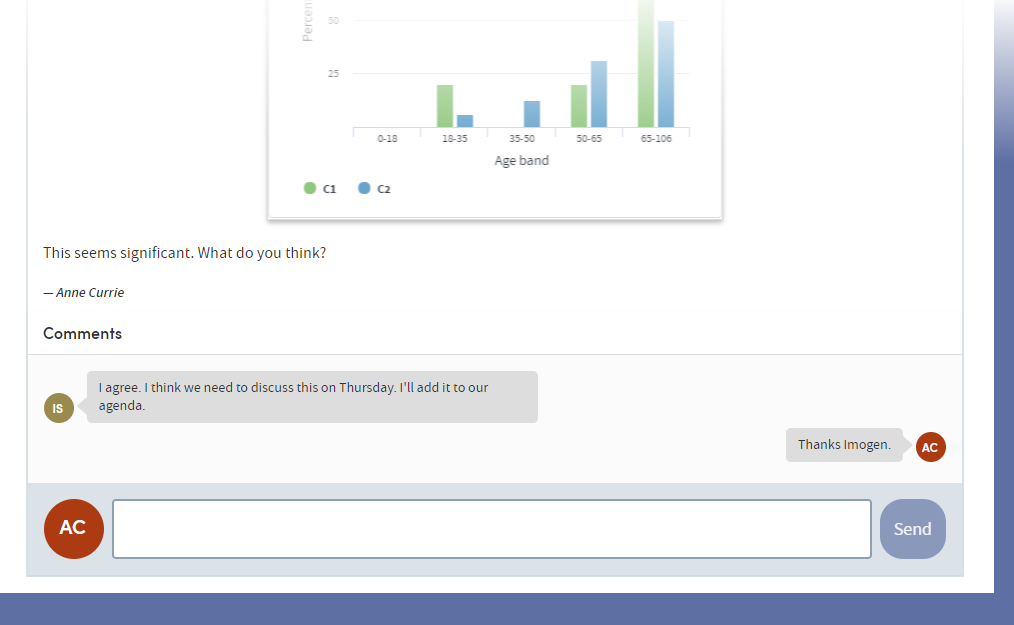
Every user who shares the report output will be sent a notification, letting them know that a new snapshot has been created. Everyone can add comments and discuss the snapshot in real time, enabling easy collaboration with your colleagues:
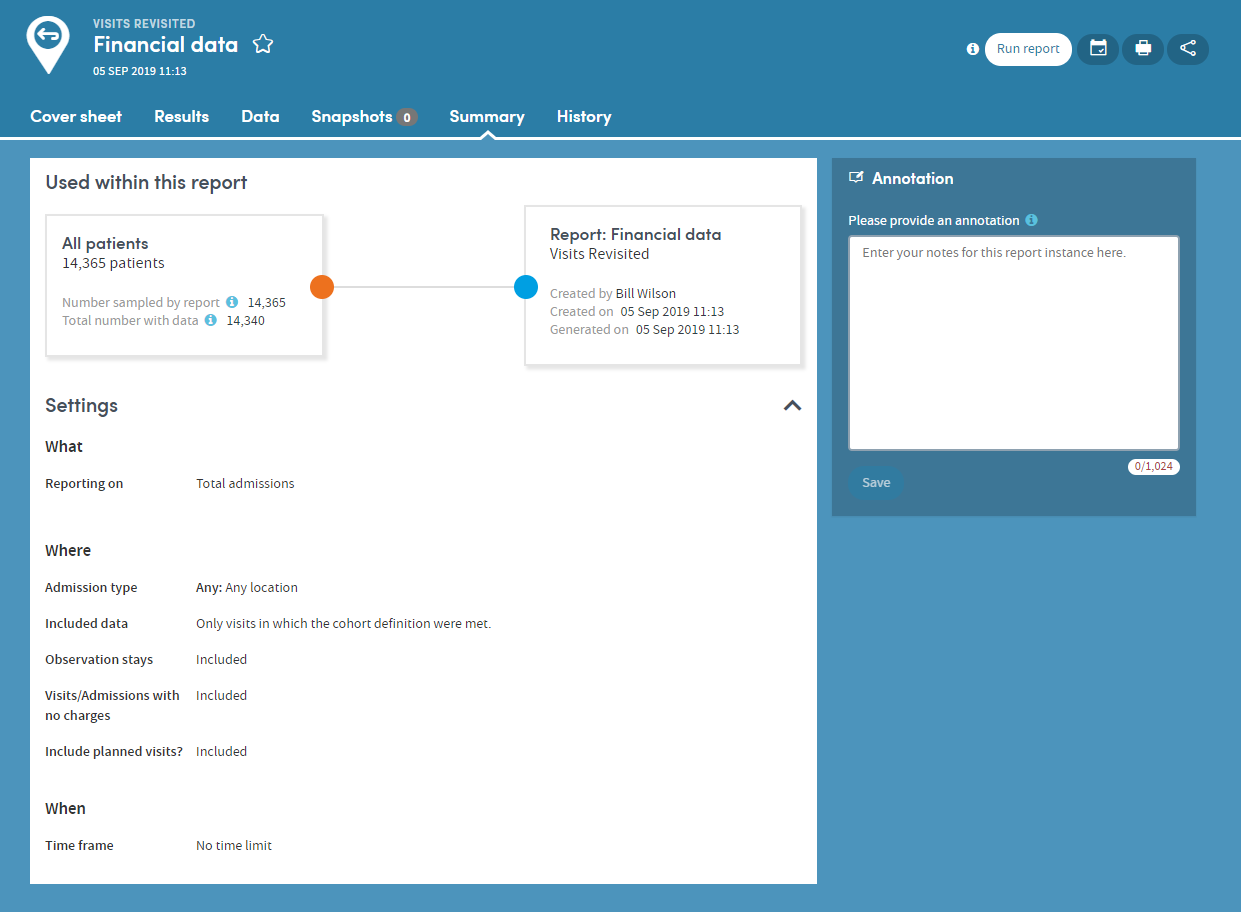
The Summary tab specifies all the options selected by the user who created the report. You can also add annotations to the Summary if you wish
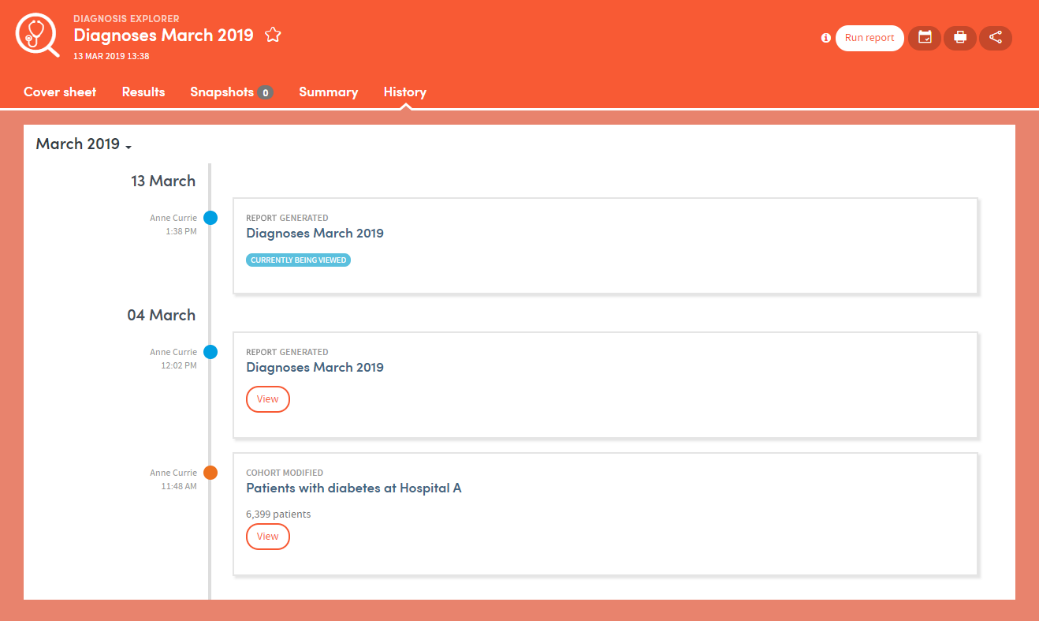
Every time a report is generated, it is saved and can be reviewed at any time. The History tab allows you to select and view any previous version of your report:
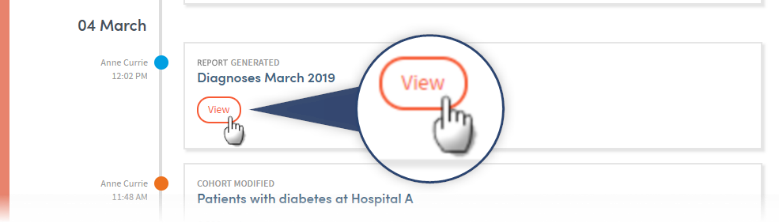
Click the View button to see previous versions of the report:
Some of the most frequently used Apps enable subgroups to be created within a report and saved as a new cohort. Activity Counter is one of these Apps.
Subgroups are a special type of cohort. They are defined by the identities of the individuals who belong to the cohort rather than by the criteria that select those individuals. Because of this, subgroups are not editable in the way that standard cohort definitions are editable, since all that Atmolytics has available to it are the IDs of the individuals in the subgroup rather than a set of criteria that can easily be applied back with Cohort Discovery.
The Results tab of your report will display the Create subgroup button:
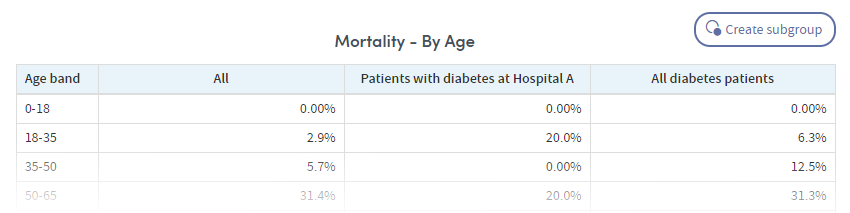
Click the button and choose the individuals you want to include by clicking the check boxes next to the data in the table. As you do so, the Subgroup description field will be populated with the relevant information. You can edit this description if you wish. You also need to complete the Subgroup name field.
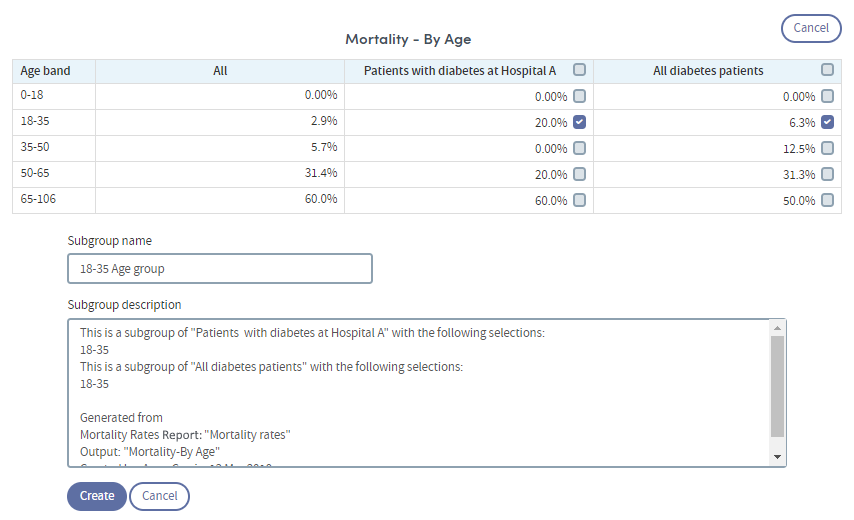
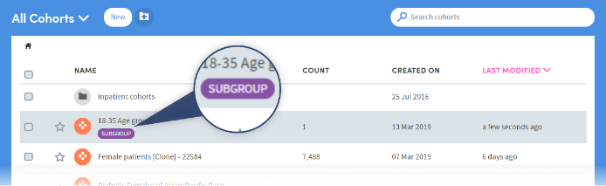
Click Create when you’re ready. The subgroup will be created. You’ll find the new cohort in the My Cohorts area, with a SUBGROUP tag under the cohort name:
Subgroups can be used in reports and (subject to user permissions), shared with other users.