- Home
 Atmolytics
-
Apps
-
Events and processes
-
Events and Processes: report outputs
Events and Processes: report outputs
An Events and Processes report consists of five tabs of data. Each of these is explained below.
You can also create subgroups of data taken from the main Events and Processes report. The Subgroups tab explains this feature.
Depending on the permissions assigned to you, you may be able to share reports with other users. See Report sharing for more information.
In addition to providing full details of every item you have included, your finished report contains a Cover sheet. This is automatically generated and contains a selection of the most significant data in your report:
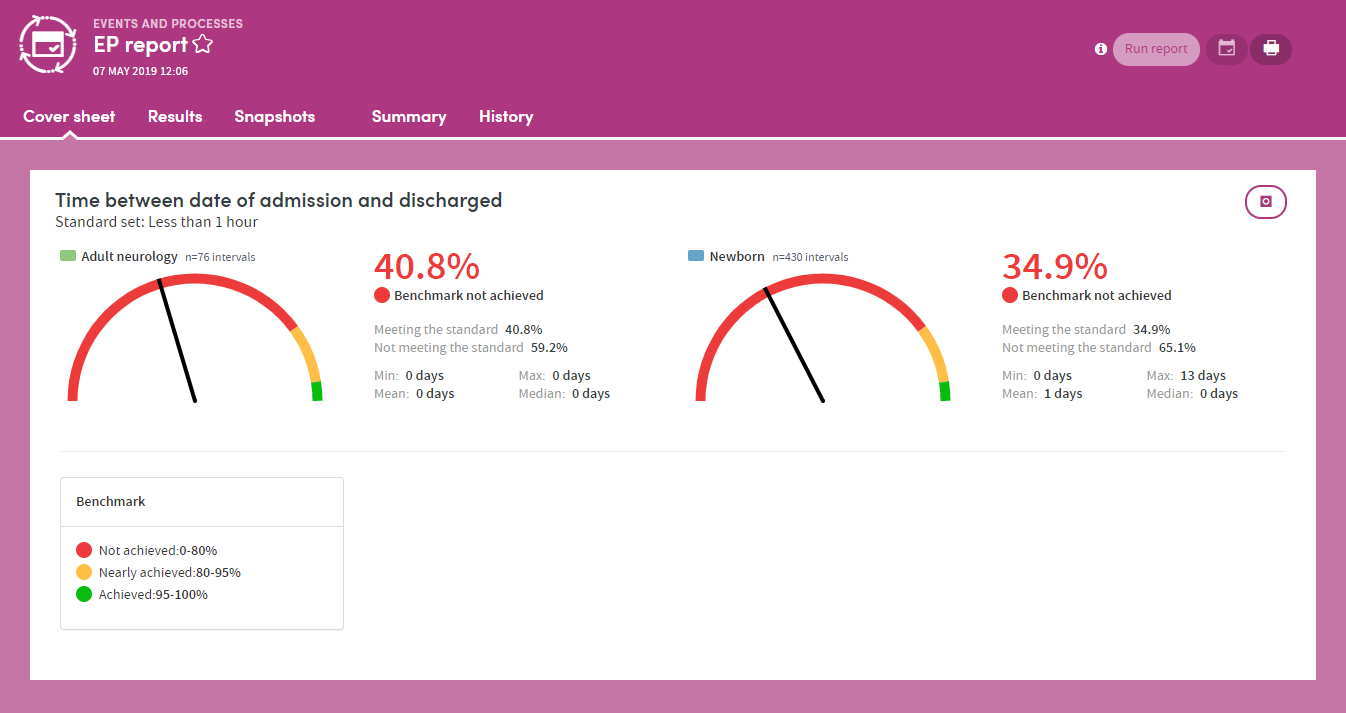
This includes details of standards met and benchmarks achieved, if you set these when creating the report output.
The Results tab allows you to browse the report output in great detail using configurable charts and graphs, and tabulated data. We recommend you spend some time browsing the data to get an idea of the full scope of information available to you here.
To start browsing, use the controls on the top right of the screen:
Data items
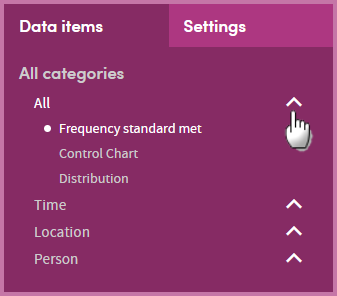
The headings here will match the Specify additional outputs selections you made when creating the report definition.
Click a heading to see the types of data available for this output.
Click the text (e.g. Control Chart) to view this in detail on the left of the results screen:
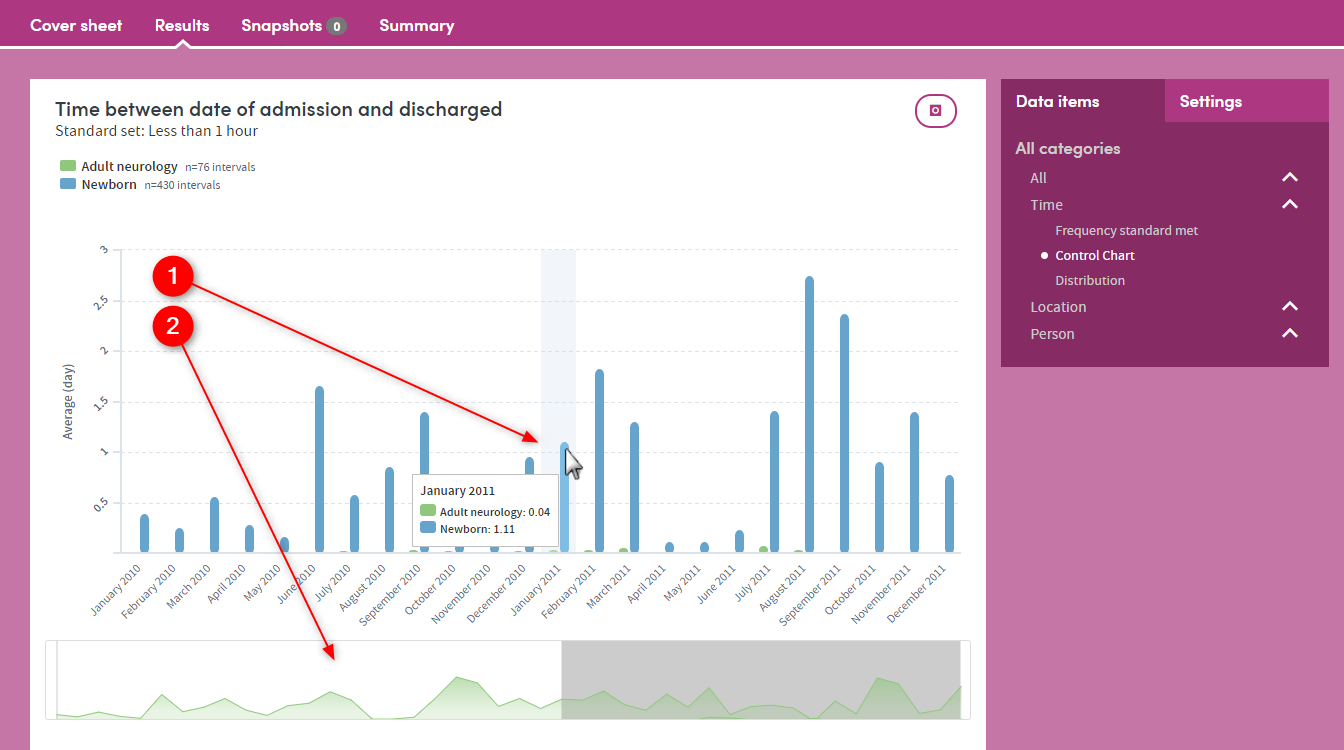
1) Hover the mouse pointer over an item in the chart to see more detail.
- This section shows an outline of all the available data items for the chart you have selected. If there are more data items than can be comfortably displayed in the chart above, only the unshaded area of this image will be shown on the chart. Click and drag on this feature to move the boundary of the shaded and unshaded areas. The chart above will automatically display the new unshaded area.
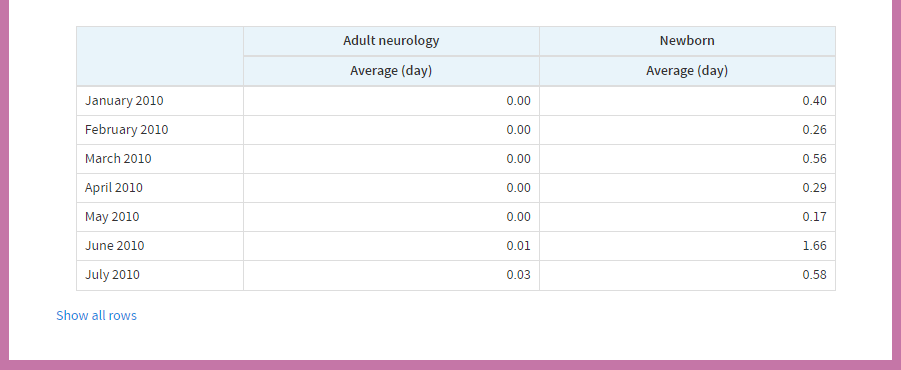
The bottom part of the results screen is where you’ll find the tabulated data relating to the chart you’re viewing:
Settings
The Data points, Chart type, and Sort order of the chart can be varied according to choice by clicking and selecting here:
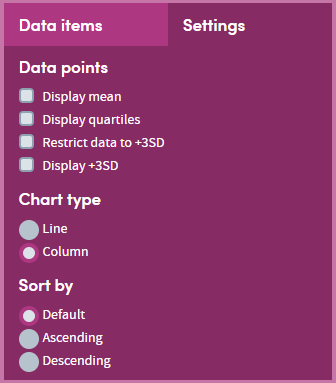
The options available to you will vary depending on the selections you’ve made in the Data items tab.
As well sharing report outputs, you can also take, share, and discuss ‘snapshots’ of your Atmolytics reports with other users, using a built-in chat room facility. At various places in the Cover sheet and Results tabs of your report, you’ll see a snapshot icon:
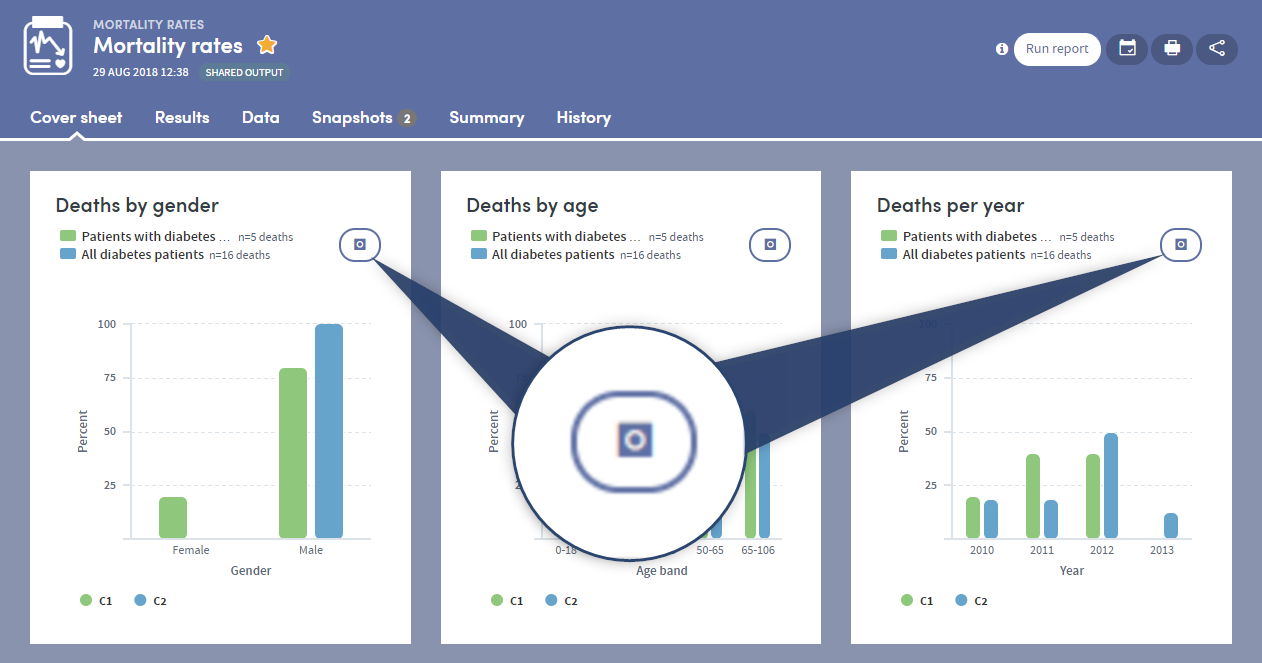
Click the icon to take a snapshot of that area of the report:
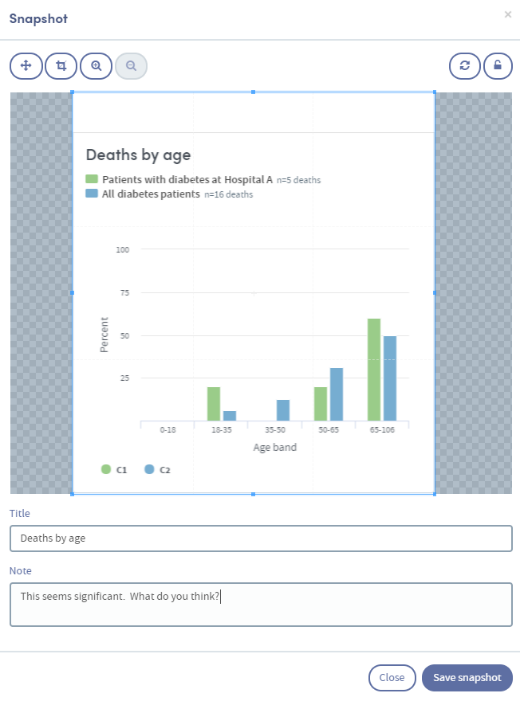
Add a title and an optional note, and click Save snapshot. Once the snapshot is saved, the image and comment are saved under the report’s snapshot tab:
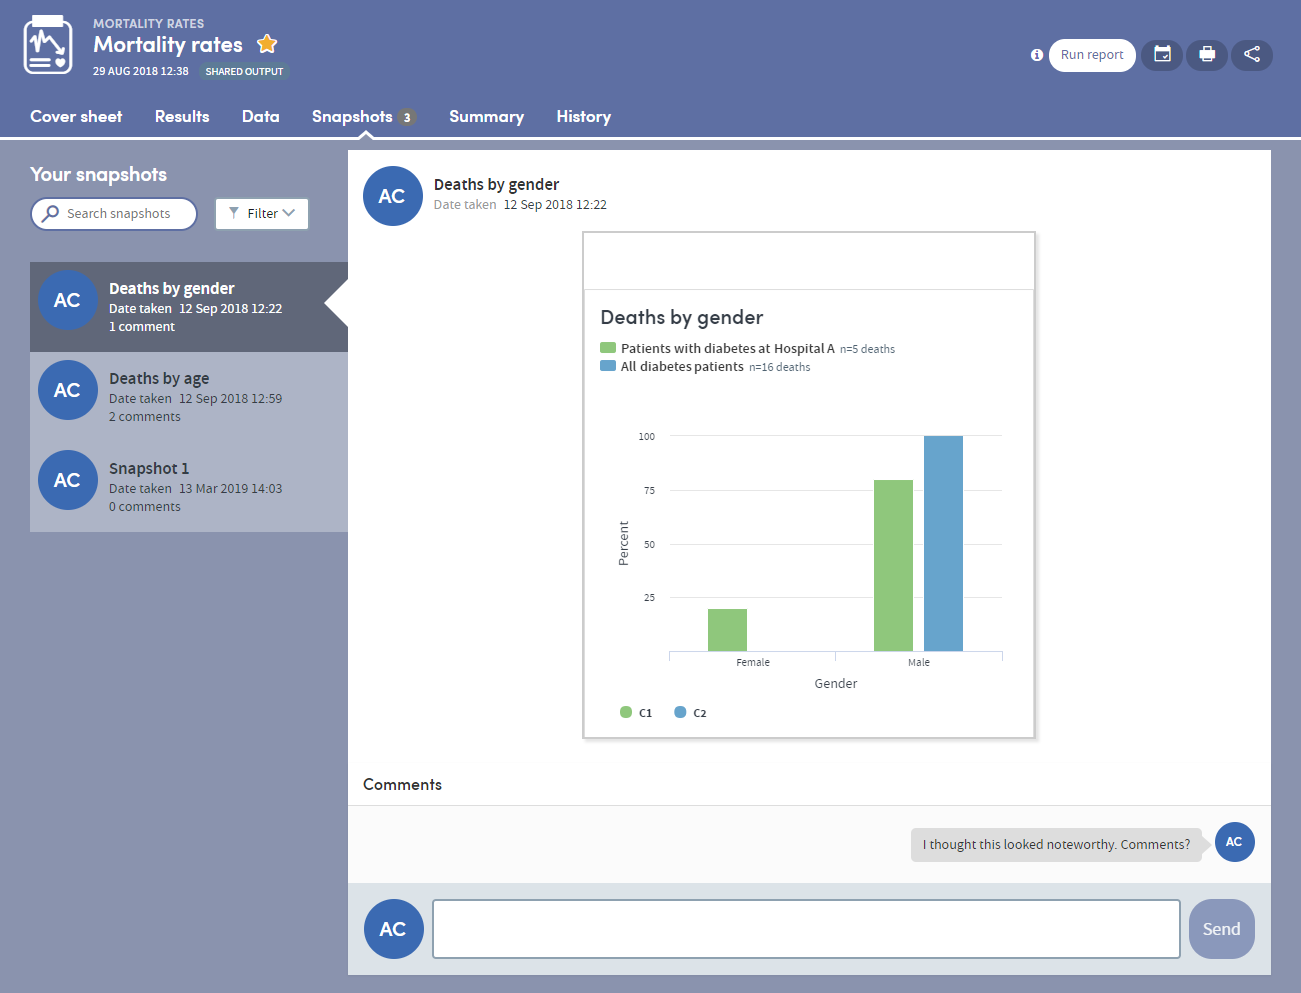
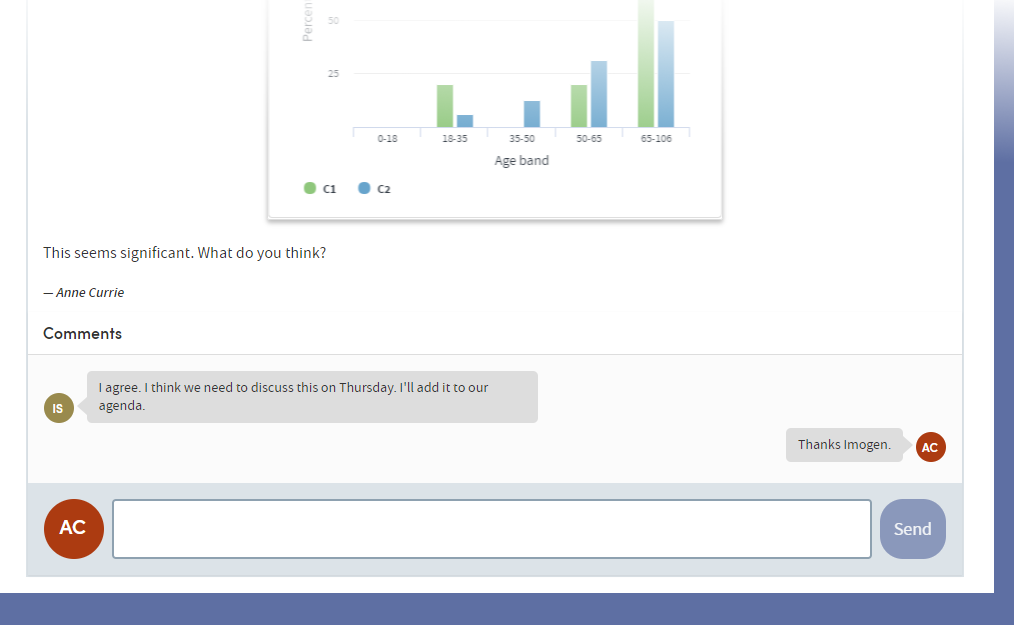
Every user who shares the report output will be sent a notification, letting them know that a new snapshot has been created. Everyone can add comments and discuss the snapshot in real time, enabling easy collaboration with your colleagues:
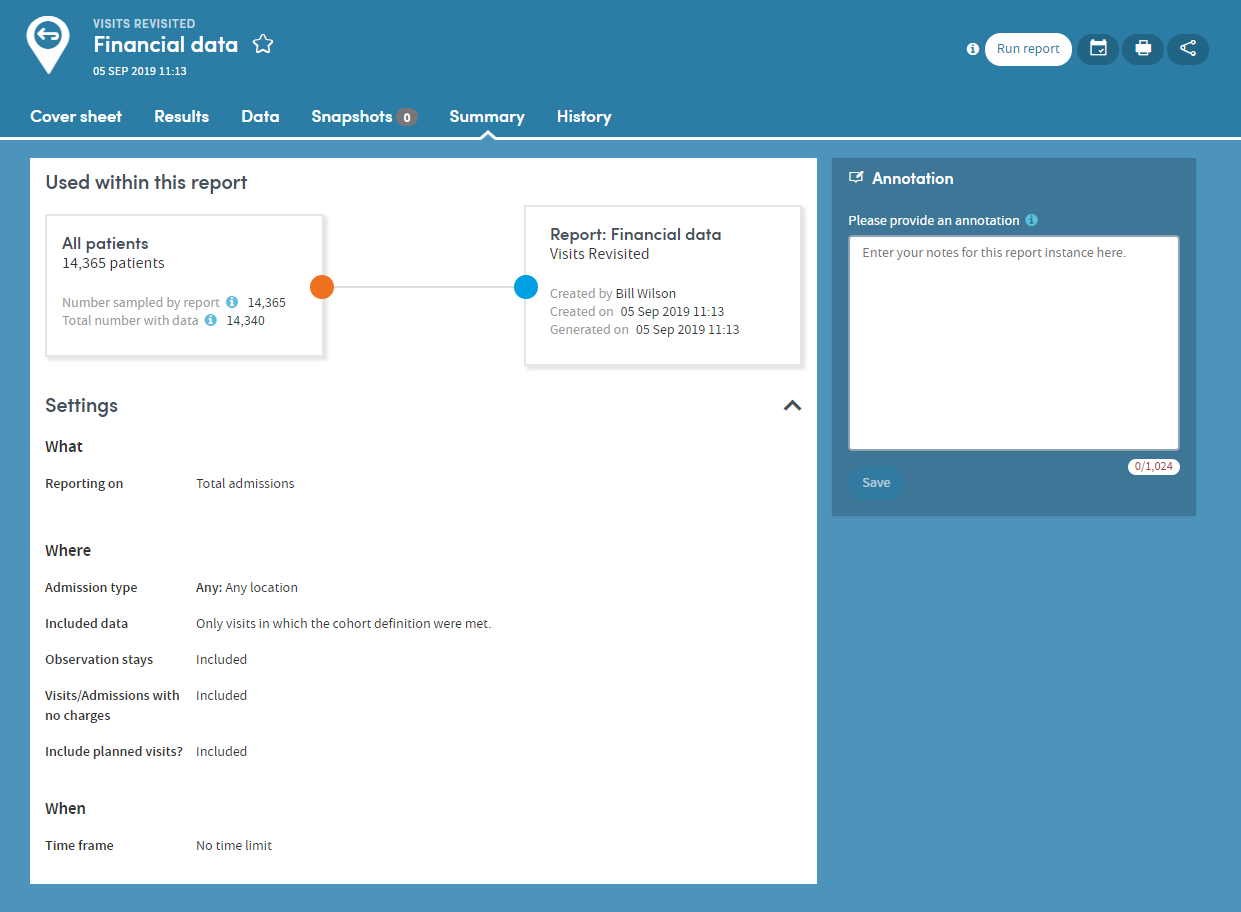
The Summary tab specifies all the options selected by the user who created the report. You can also add annotations to the Summary if you wish:
Every time a report is generated, it is saved and can be reviewed at any time. The History tab allows you to select and view any previous version of your report:
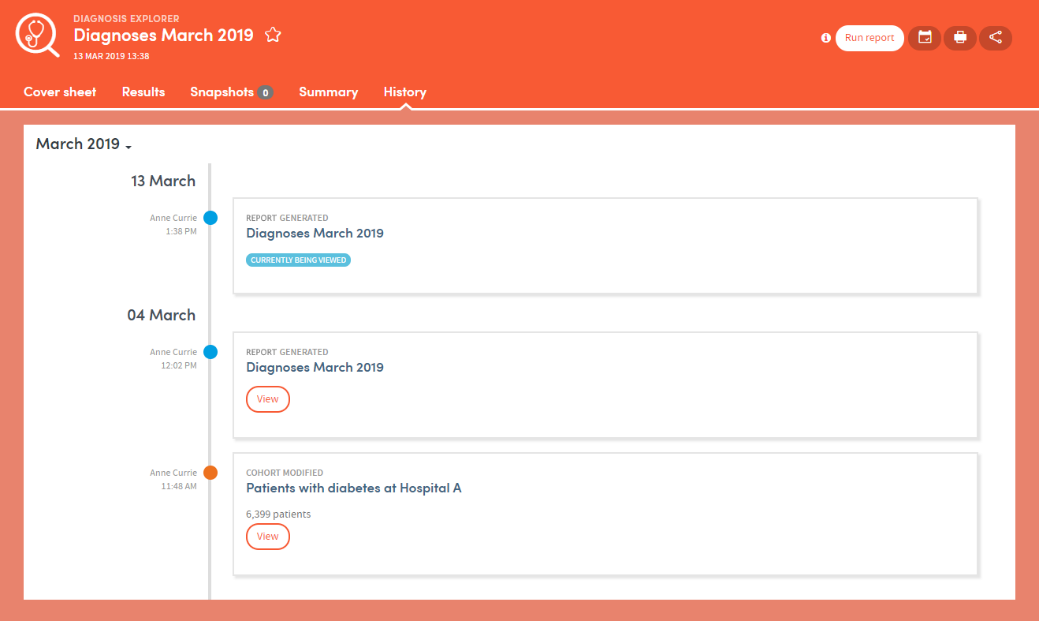
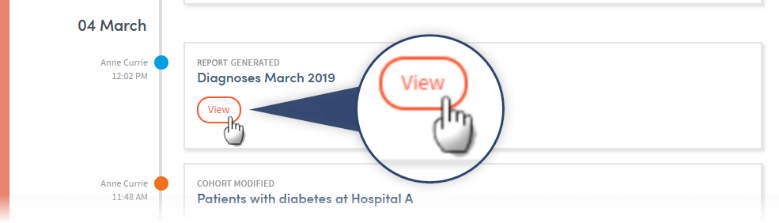
Click the View button to see previous versions of the report:
Some of the most frequently used Apps enable subgroups to be created within a report and saved as a new cohort. Events and Processes is one of these Apps.
Subgroups are a special type of cohort. They are defined by the identities of the individuals who belong to the cohort rather than by the criteria that select those individuals. Because of this, subgroups are not editable in the way that standard cohort definitions are editable, since all that Atmolytics has available to it are the IDs of the individuals in the subgroup rather than a set of criteria that can easily be applied back with Cohort Discovery.
The Results tab of your report will display the Create subgroup button:
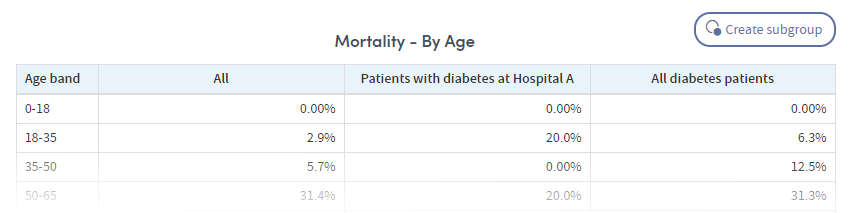
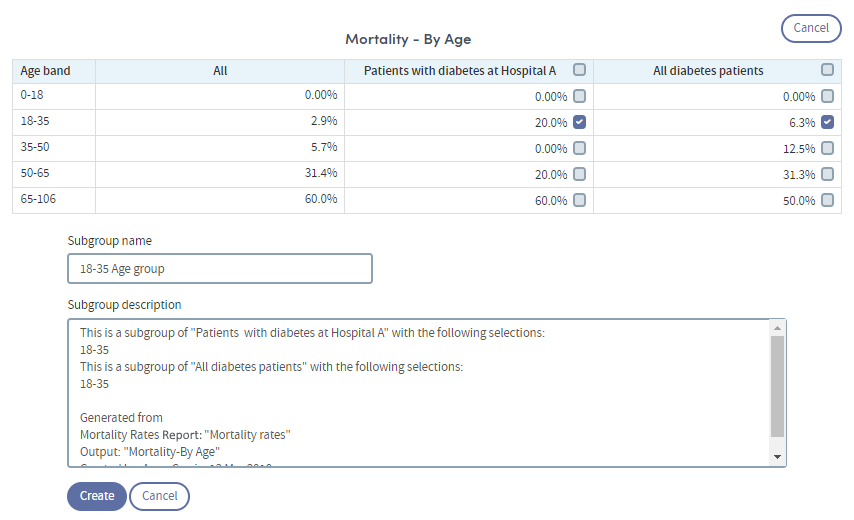
Click the button and choose the individuals you want to include by clicking the check boxes next to the data in the table. As you do so, the Subgroup description field will be populated with the relevant information. You can edit this description if you wish. You also need to complete the Subgroup name field.
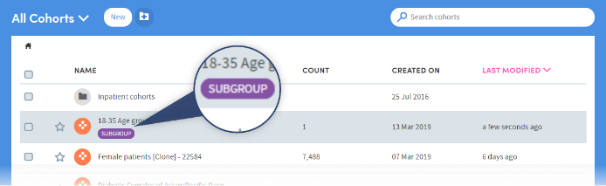
Click Create when you’re ready. The subgroup will be created. You’ll find the new cohort in the My Cohorts area, with a SUBGROUP tag under the cohort name:
Subgroups can be used in reports and (subject to user permissions), shared with other users.