- Home
 Atmolytics
-
Apps
-
Events and processes
-
Events and Processes: report creation
Events and Processes: report creation
To create an Events and Processes report:
1 Select the App
2 Follow the Who: step to choose the cohort(s) you want to report on
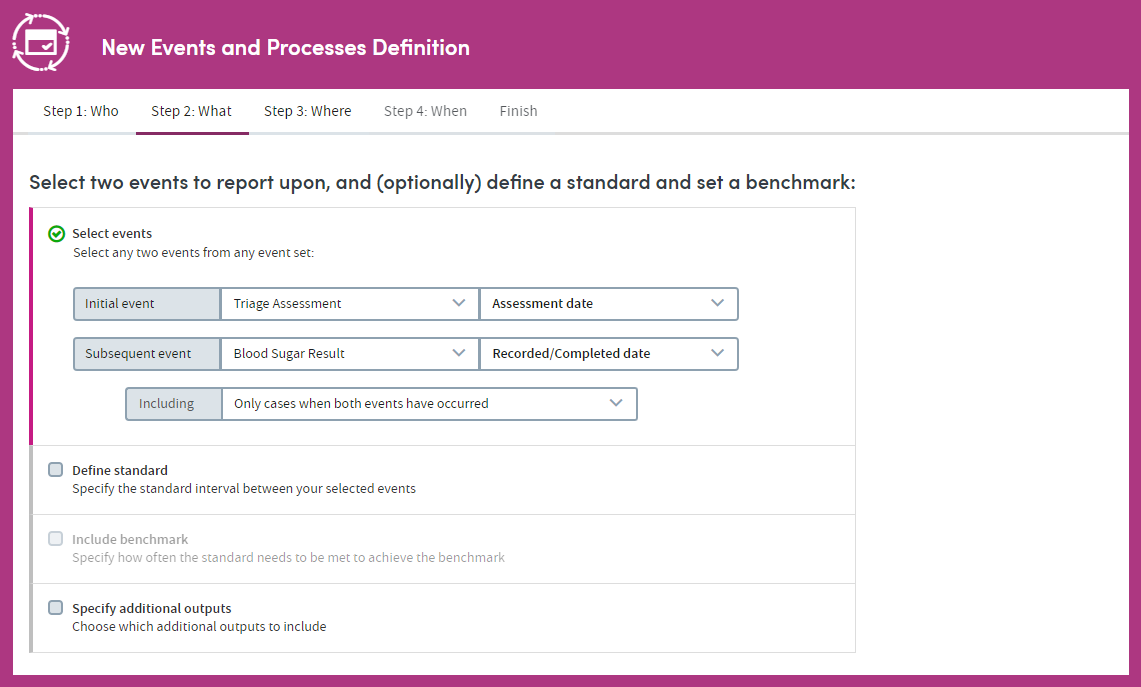
Here you’ll:
- Select events to report on;
- Define a standard interval between your selected events;
- Set a benchmark; and
- Specify any additional outputs you want to include
These steps are fully explained in the tabs below.
You can report on the time interval between any two events within any two Event sets. The pairs of events that are identified and included in the report output will always have occurred within a single admission/visit.
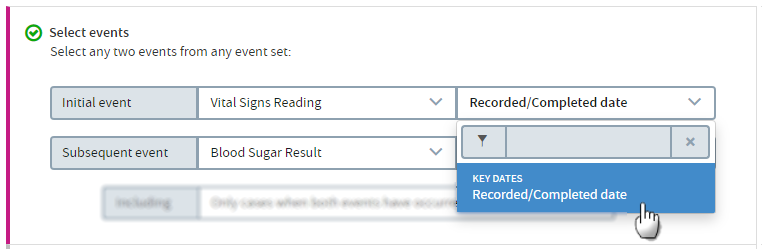
There is also the concept of a meta event of Recorded/Completed Date. Regardless of whether the date the event occurred is directly recorded in the dataset, you may use the event’s completed date as an initial or subsequent event.
The event sets included in the selection list (and the events contained within those sets) will have been pre-selected by your organization. Choose an initial event set and event by selecting from the drop-down lists:
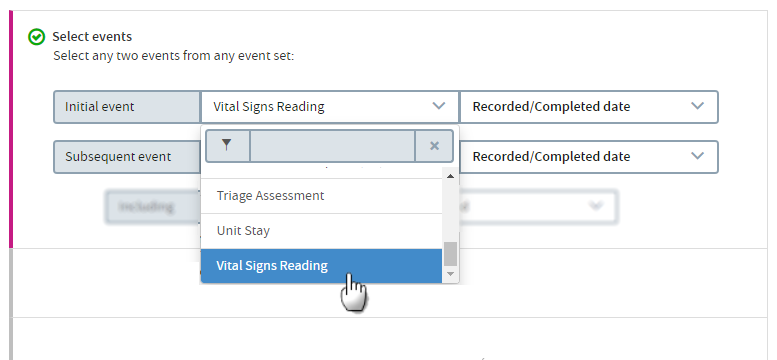
Do the same for the subsequent event set and events.
You can also search for event sets and events if you have a long list to choose from:
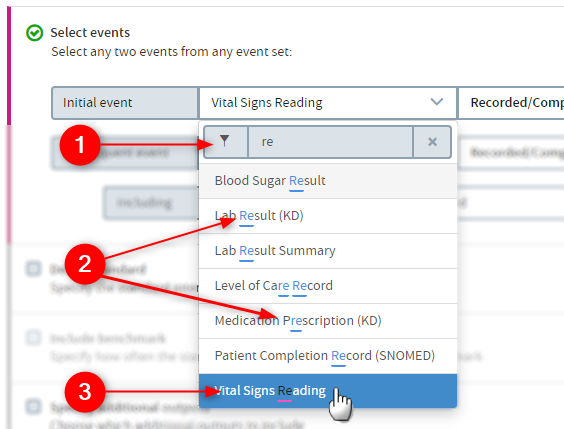
- Start typing your search term into the text box.
- The list below will dynamically display all the items containing your search term, wherever it appears in the term text.
- Click an item to select it for inclusion in the report.
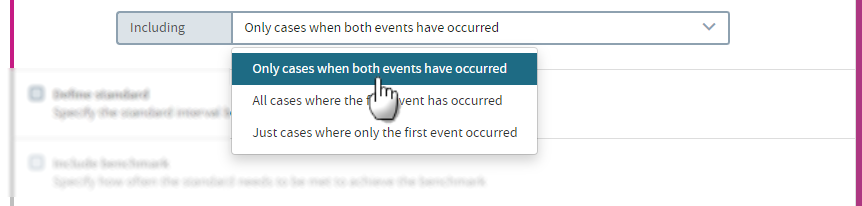
Including
Next, you need to choose which occurrences of these events to report on. The Including drop-down list contains three options for you to choose from:
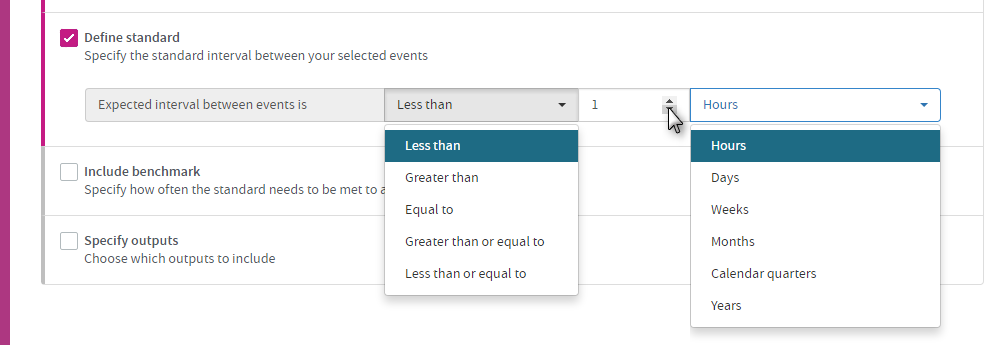
If you wish, you can specify a standard interval between your selected events. This is the interval of time that is expected to take place between the two events. Click the check box to select this option, then choose the operator, number, and unit you want to apply:
If you specify a standard interval, you may also set a benchmark. This describes how often the expected standard interval should be met. Click the check box to select this option. The following controls will appear:
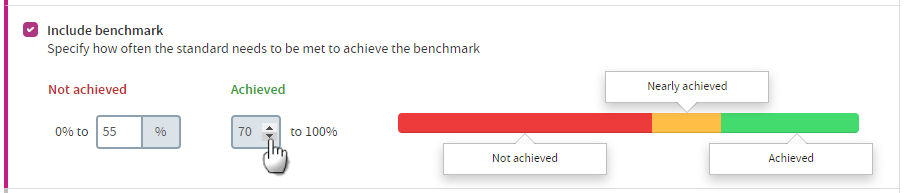
Click the up and down arrows to specify:
- The percentage of occurrences which, failing to meet the standard interval, would lead to the benchmark not being achieved, and:
- The percentage of occurrences which need to meet the standard interval in order to achieve the benchmark.
By setting these percentages separately, you have the option of creating a mid-interval which indicates where the benchmark was nearly achieved.
This feature allows you to choose which performance data to include in your report. If you click the check box to access this feature, the following options will appear:
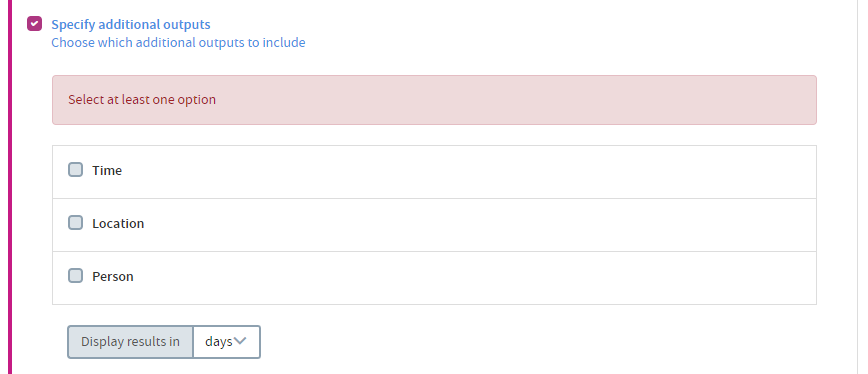
You can select any or all of the available options. Each option is applied independently of any others you choose, creating discrete outputs which you can then browse individually within the report.
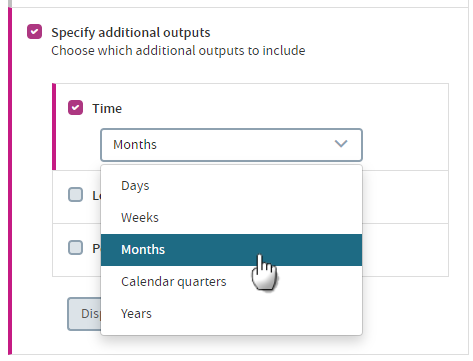
Time
The report output will collate and display performance data using a time period of your choosing (e.g. week-by-week, month-by-month, etc.). Choose a time period from the drop-down list:
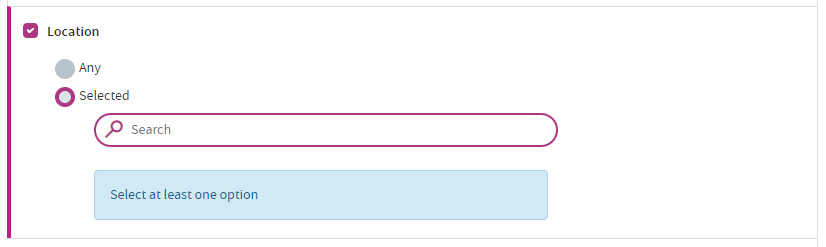
Location
The report output will collate and display performance data by location. You can choose to report on performance data from all the locations available to you, or you can search for and select any number of specific locations by clicking the Selected button:
To choose specific locations:
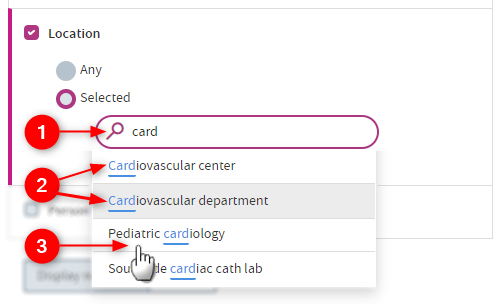
- Start typing your search text into the text box
- The list below will dynamically display all the locations containing your search text, wherever it appears in the location name.
- Click a location name to select it for inclusion in the report. The location will appear below the search field:
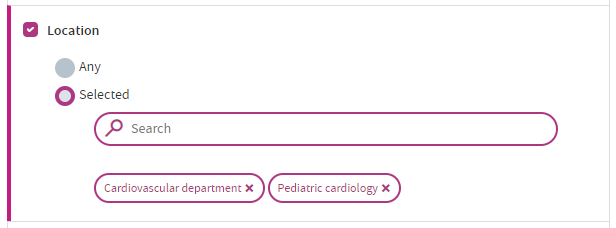
Continue searching for and adding locations as necessary. To remove a location from the list, click the cross to the right of its name.
Person
The report output will collate and display performance data by person (i.e. the members of staff involved in the events which are included in the report output). You can choose to:
- Report on performance data from all the staff available to you,
- Report on performance data by staff role,
- Search for and select any number of specific individuals.
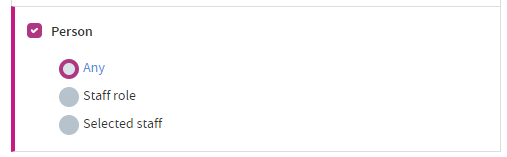
To include all the staff available to you:
Choose Any (you’ll probably find that this is the default option):
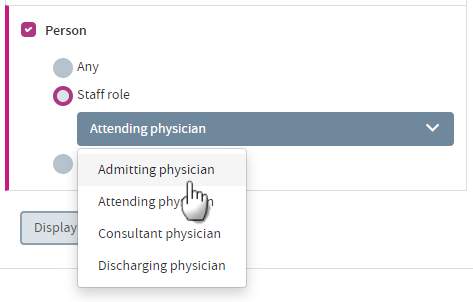
To report on a staff role:
Choose Staff role, and select from the drop-down list:
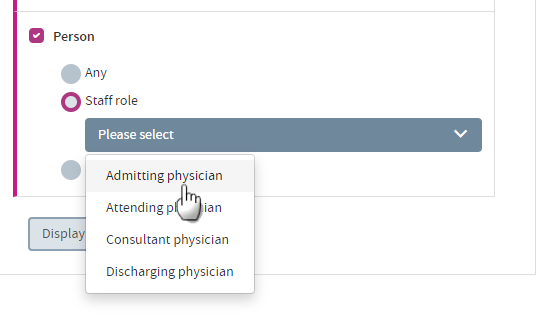
To include specific individuals in your report output:
Choose Selected Staff. First, choose the staff role of the person you’re searching for from the drop-down list:
Next, you need to search for the specific person you want to add to the report output:
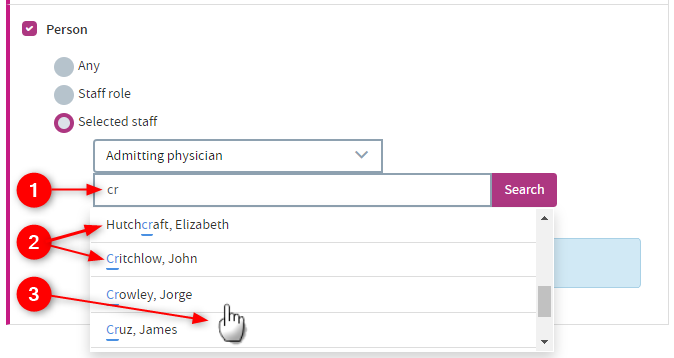
- Type your text into the text box, and click Search. You do not need to type the full name
- The list below will display all the names containing your search text, wherever it appears in the name
- Click the text of a name to select it for inclusion in the report. The name will appear below the search field:
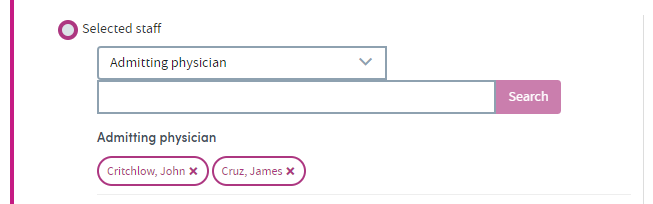
Continue searching and adding individuals as necessary. To remove a person from the list, click the cross on the right of their name.
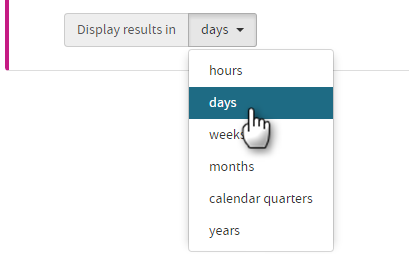
Display results in:
This final option is where you choose how the report output will display the time intervals between the first and subsequent dates of your pairs of events. Choose from the drop-down list:
Click Next when you’re happy with your selections, and move on to the Where: step of the process.