- Home
 Atmolytics
-
Apps
-
Data export
-
Data Export: report outputs
Data Export: report outputs
Date Export report consists of three tabs. Each of these is explained below.
Depending on the permissions assigned to you, you may be able to share reports with other users.
We’ve added App-specific images wherever we can. In some places you might see images taken from other Apps, but in these cases the processes and features are exactly the same for every App.
For the report output example below, we chose criteria including Patient details and visits, three datasets, and two additional fields. The report compares a cohort to All Patients, which is represented by the two panels: one with green headings and one with blue headings.
The Results screen will look something like this, depending on the options you selected when creating the report:
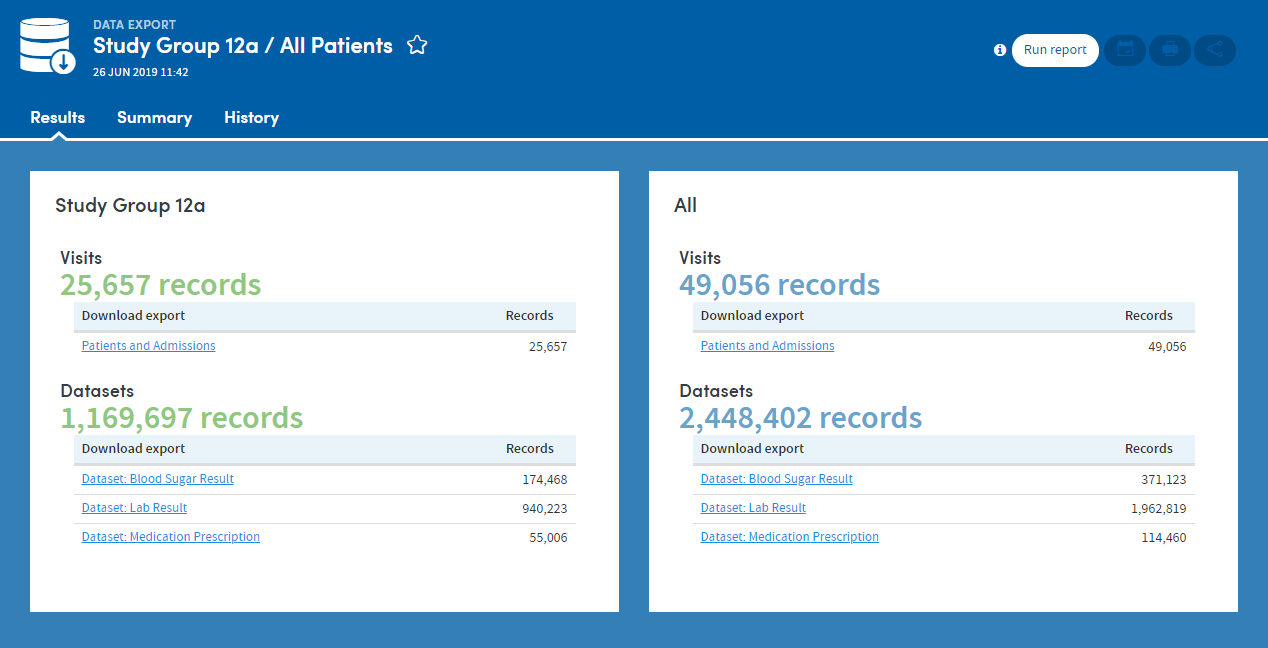
In our example, the Visits and Patient details data has been exported as a single downloadable file, listed under the Visits headings for each cohort.
Datasets
Each dataset we exported is available for download as a separate file. Each file will also contain the additional data collection start and end date fields we chose to include when specifying the report output.
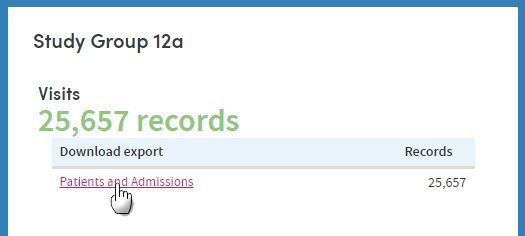
Downloading your output files
Click the download link:
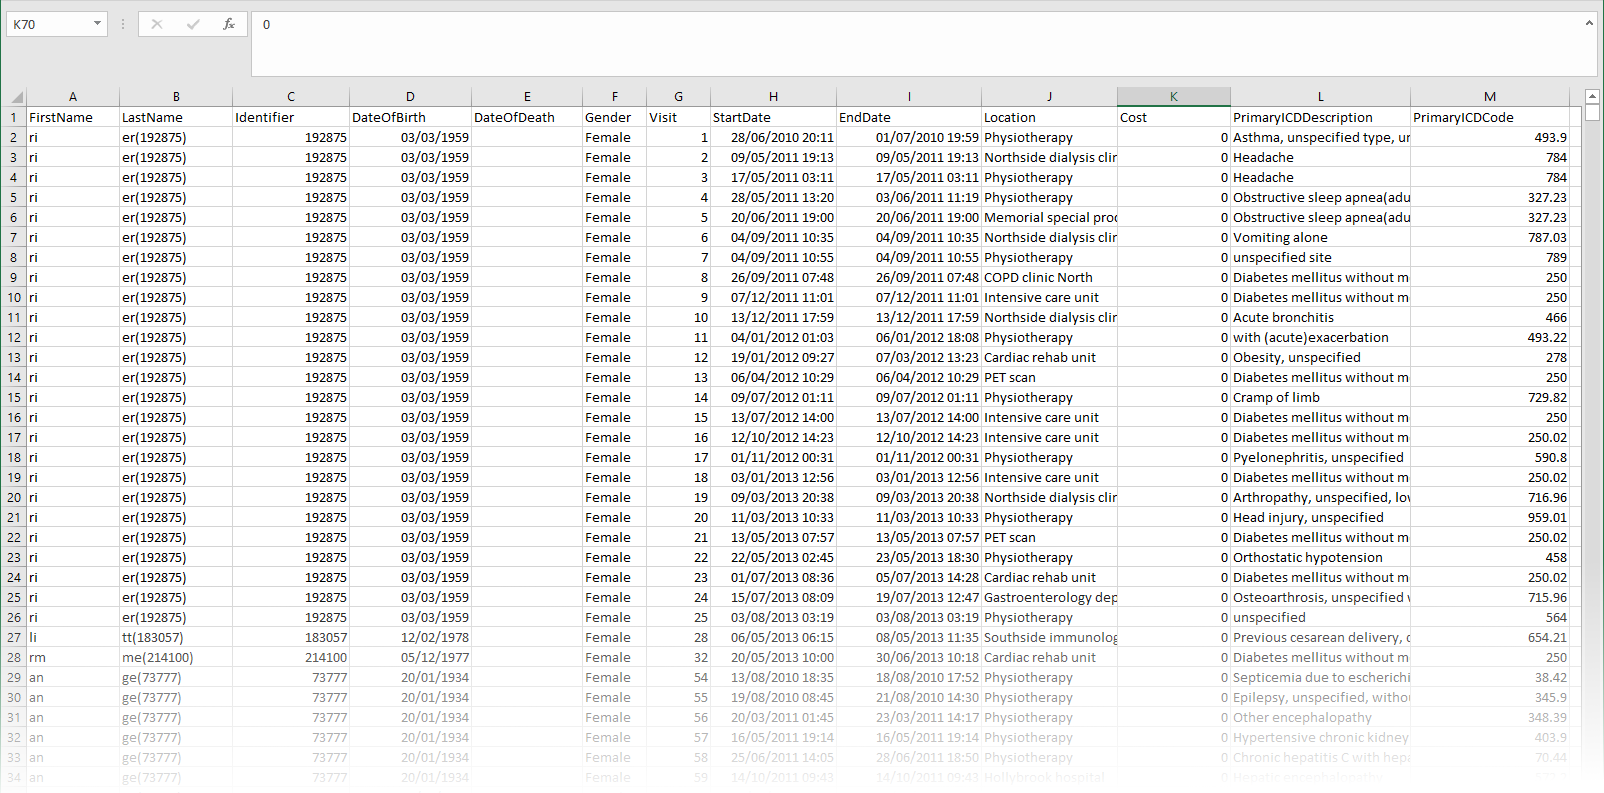
The .csv file will be downloaded in .zip format and can be accessed via Excel or other dedicated statistical packages. Here is a section of a sample export, viewed in Excel:
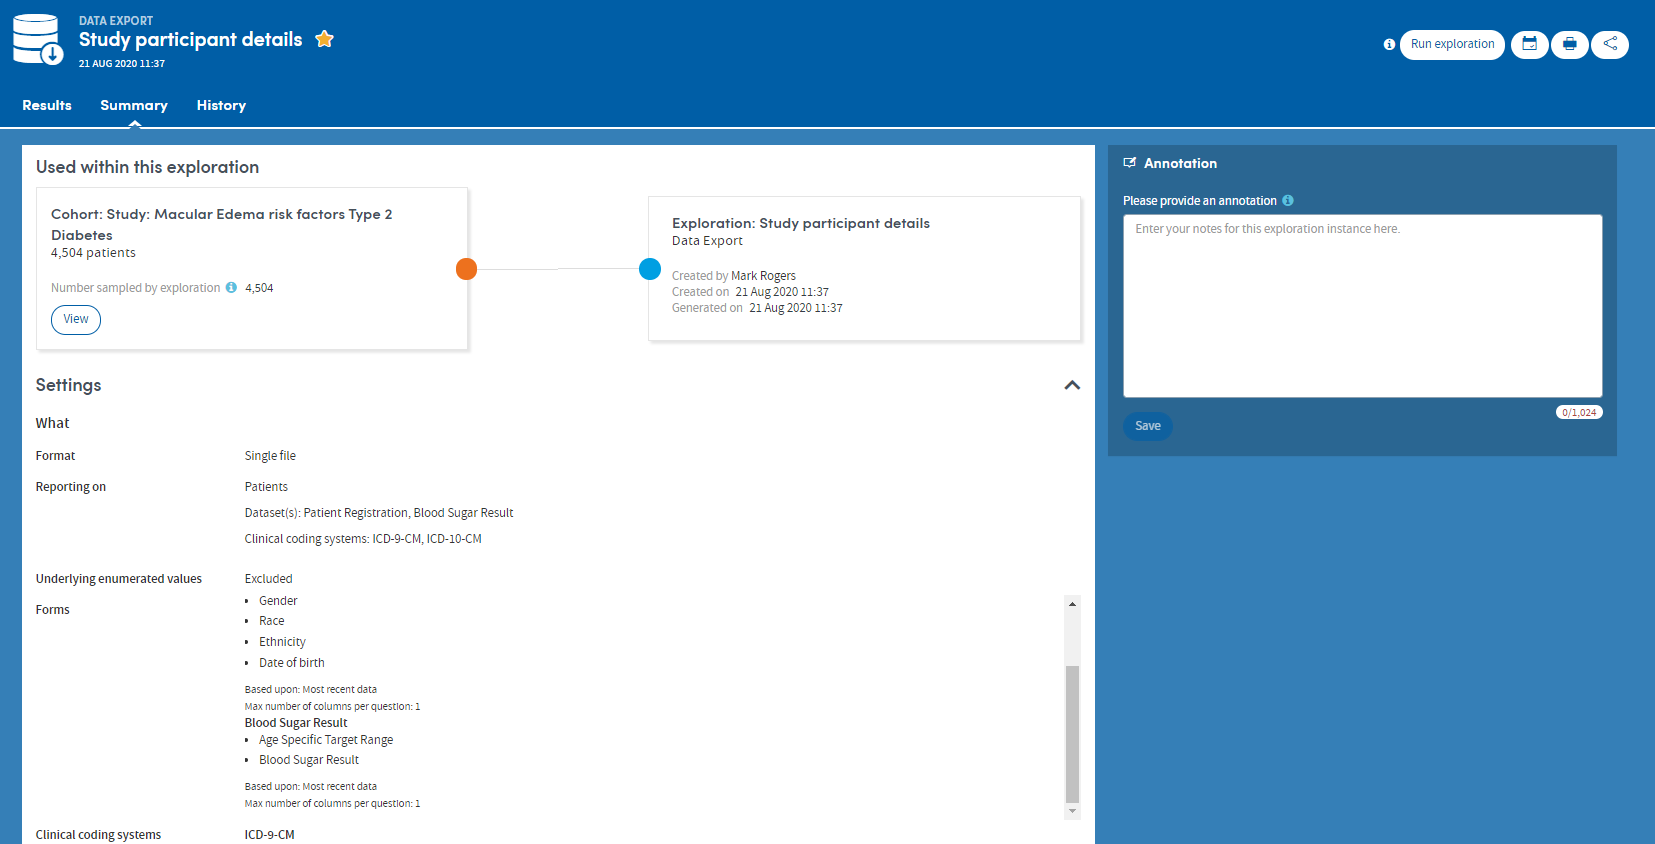
The Summary tab specifies all the options selected by the user who created the report. You can also add annotations to the Summary if you wish:
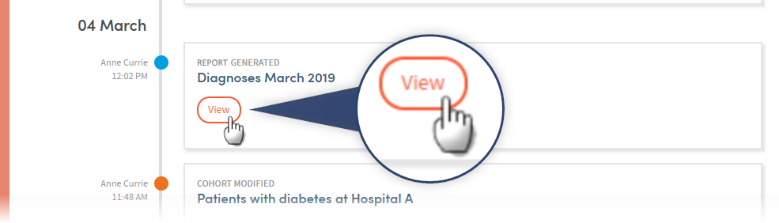
Every time a report is generated, it is saved and can be reviewed at any time. The History tab allows you to select and view any previous version of your report:
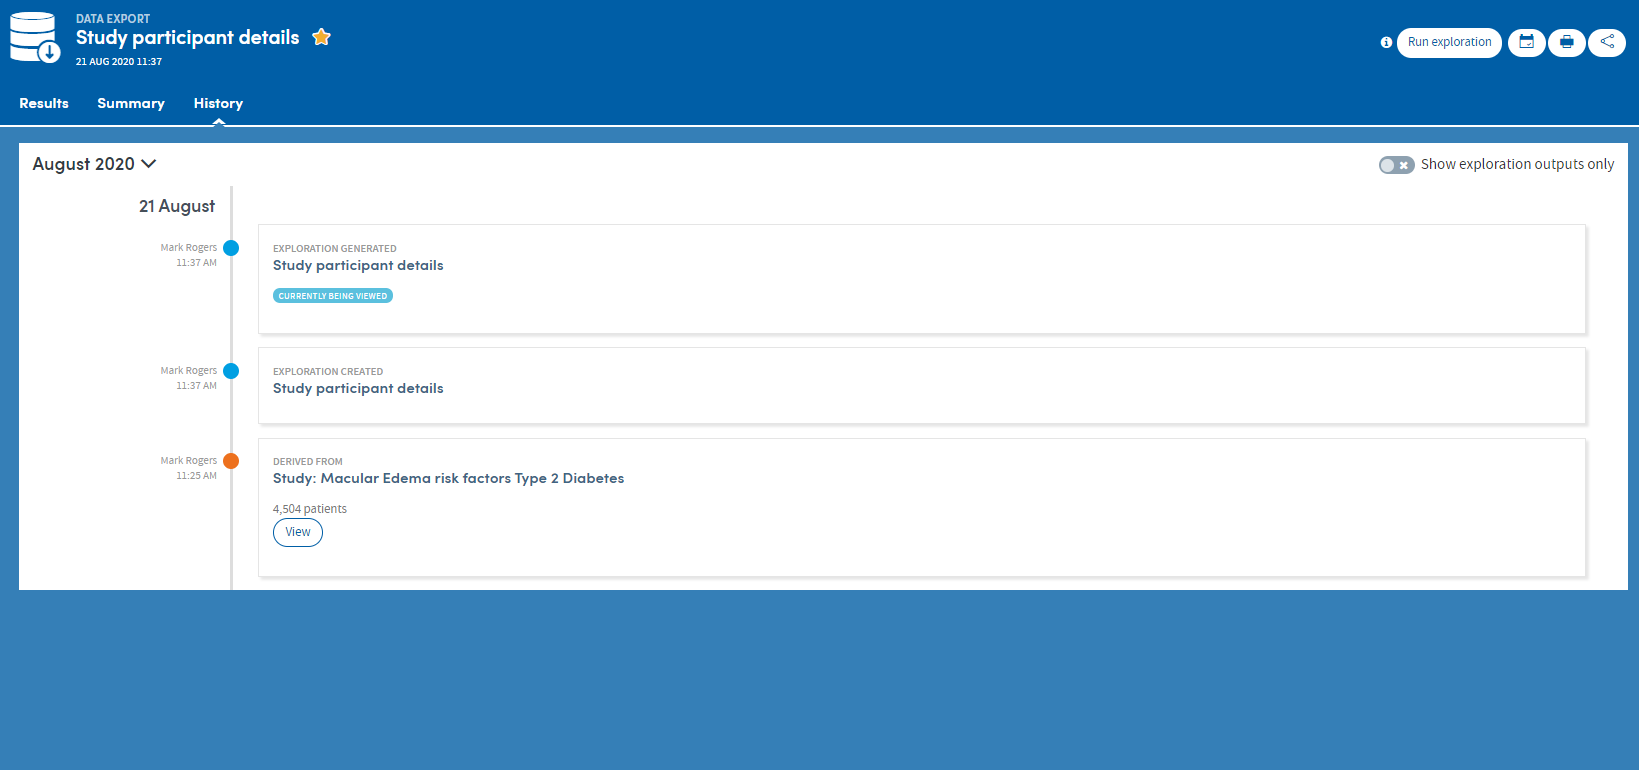
Click the View button to see previous versions of the report: