- Home
 Care Partner
-
Software
-
Service user records
-
Dashboard
Dashboard
The first section of the Dashboard is an overview. This gives an individual view of the Service User’s total number of Activities, Activity Records, Assessments, Contact Records, Open Activities and Overdue Events.
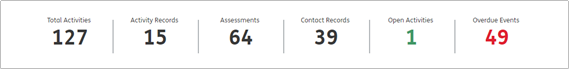
The number of Open Activities has been colour coded, to help you visualise how many Activities need to be closed or actioned.
- When there are 1-4 Open Activities, the number will be green.
- When there are 5-10 Open Activities, the number will be amber.
- When there are 11+ Open Activities, the number will be red.
You can click on any of the overview items to open a pop-up with an overview of the Activities, Activity Records, Assessments, Contact Records, Open Activities and Overdue Events:
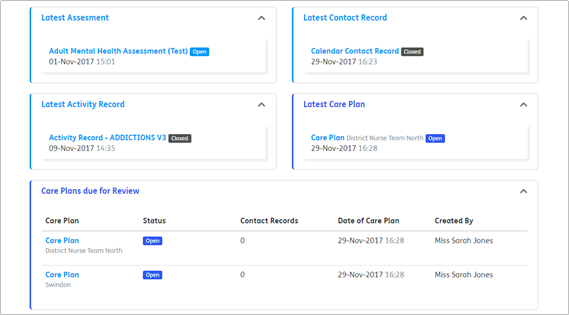
Below the overview section of the Dashboard you will see panels containing details of:
- Latest Assessment
- Latest Contact Record
- Latest Activity Record
- Latest Care Plan
- Care Plans due for Review (these are Care Plans that are either Open or Current)
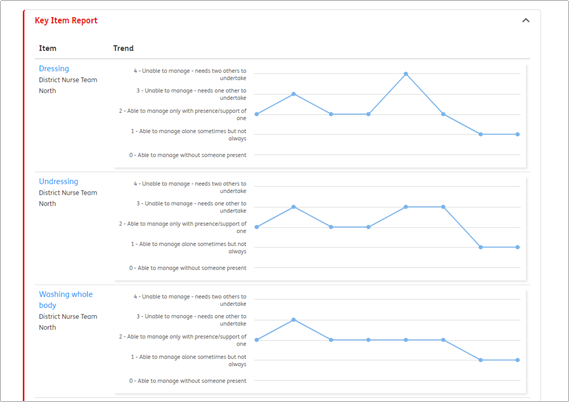
The Dashboard will include a Key Item Report. This will show a graph of each individual’s answers for their current Key Items over time (up to 50 answers), based on Centres of Care.
You can hover over each point of the graph to see the date and time of the Key Item and what the answer was.