Report outputs: the basics
Report outputs have a standard format, including a range of standard options:

You can choose to Run the report again, Schedule the report, Print the data from the current tab, or Share the output with other users by clicking the buttons on the top right of the report screen. You can choose to share either the most recent instance of the report or all instances, with other users who have the same role as you.
The content of report outputs depends on the type of App you’re working with, but all reports contain Results, Summary and History tabs. Most report outputs will include Cover sheet and Data tabs.

Reports include a range of interactive facilities designed to enable easy sorting and sifting of the data. Again, these are tailored for each App.
You can also take Snapshots of your reports and share them with other users.
Cover sheet
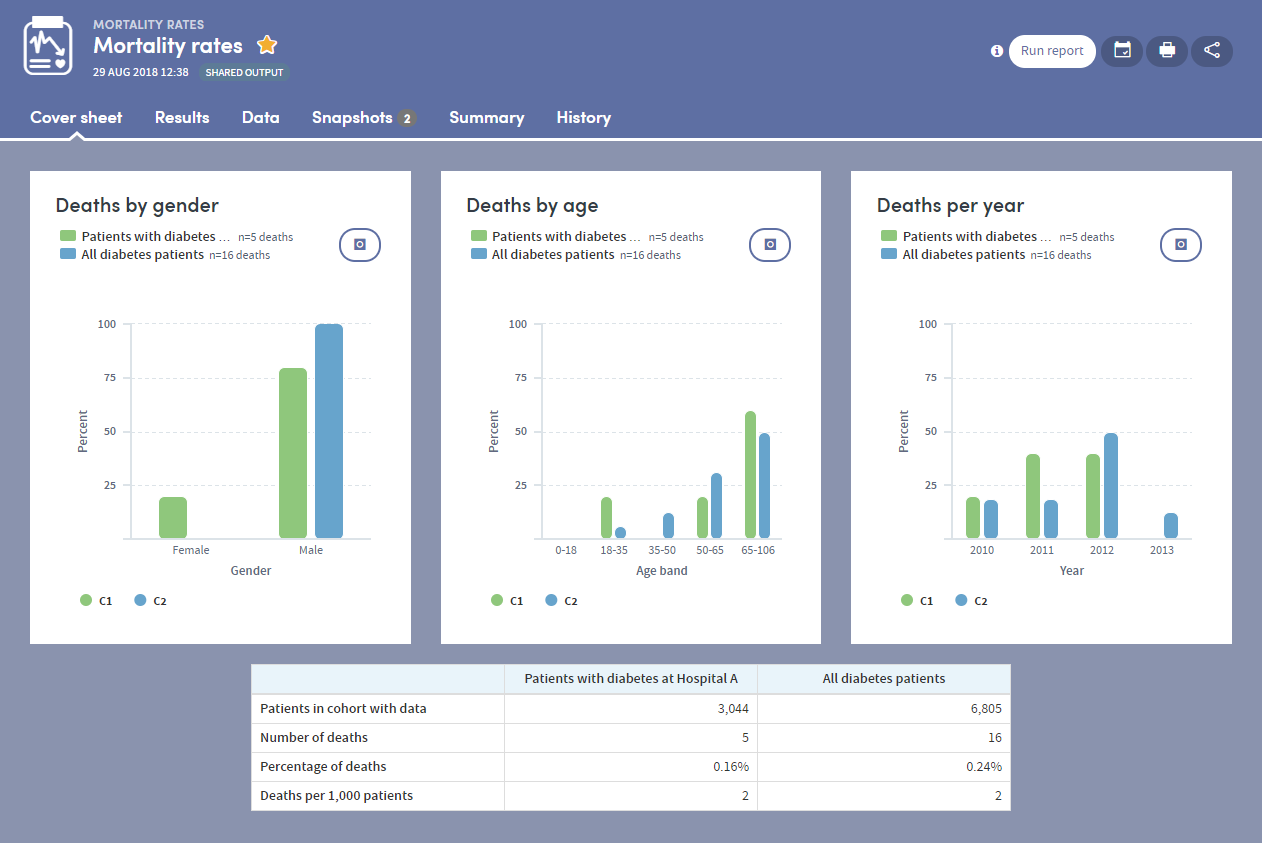
The Cover sheet of a report highlights key findings from the report:
Results tab
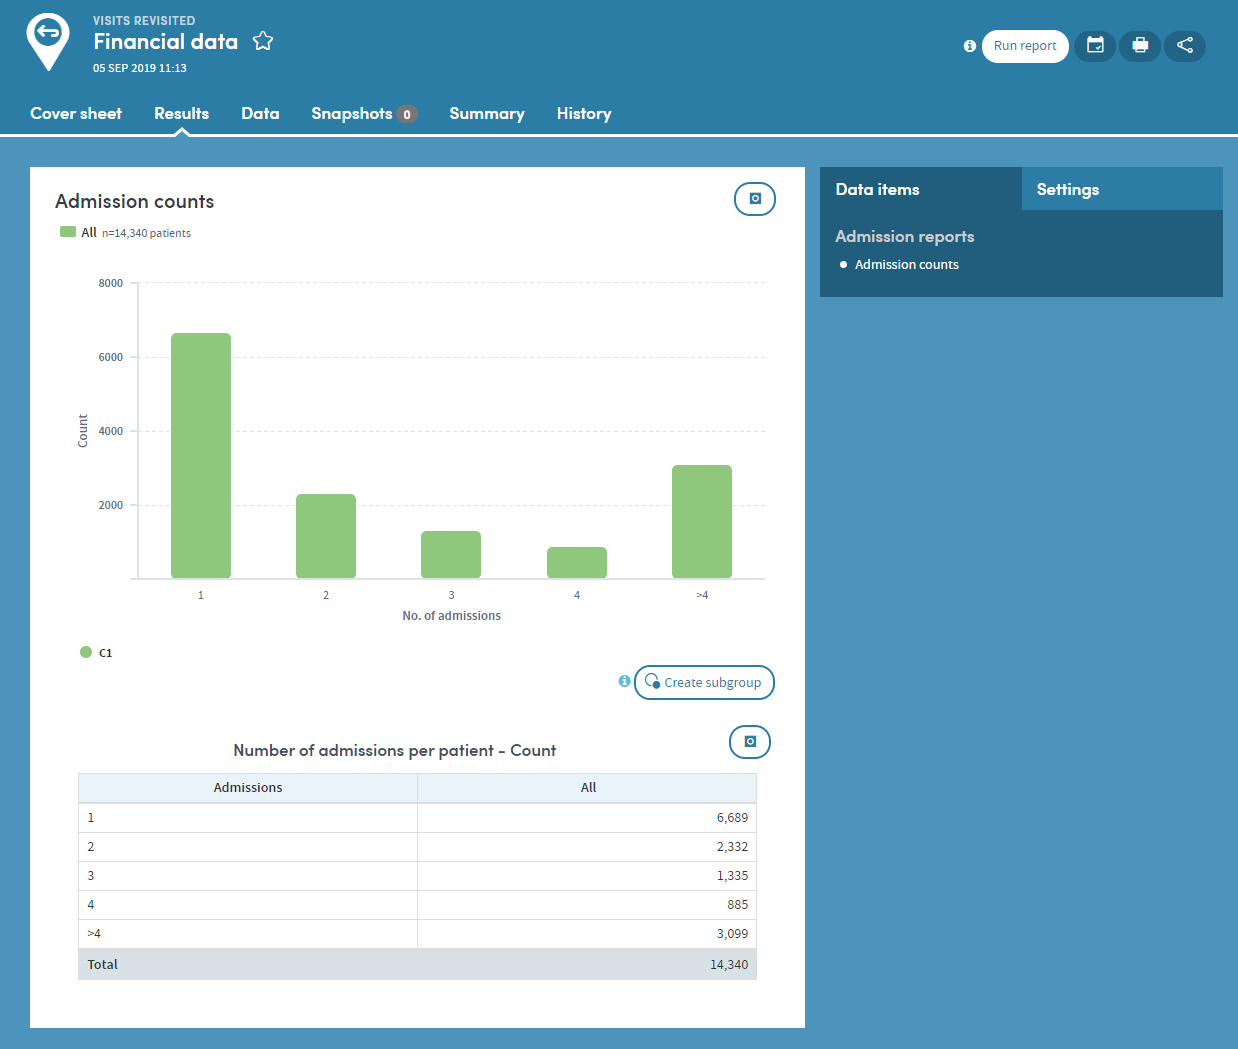
The Results tab allows you to browse the report data in great depth, on an item-by-item basis with both graphical and tabular representations where appropriate.
You’ll find a range of interactive facilities designed to enable easy sorting and sifting of the data. Again, these are tailored for each App, but you can see an example below:
Data tab
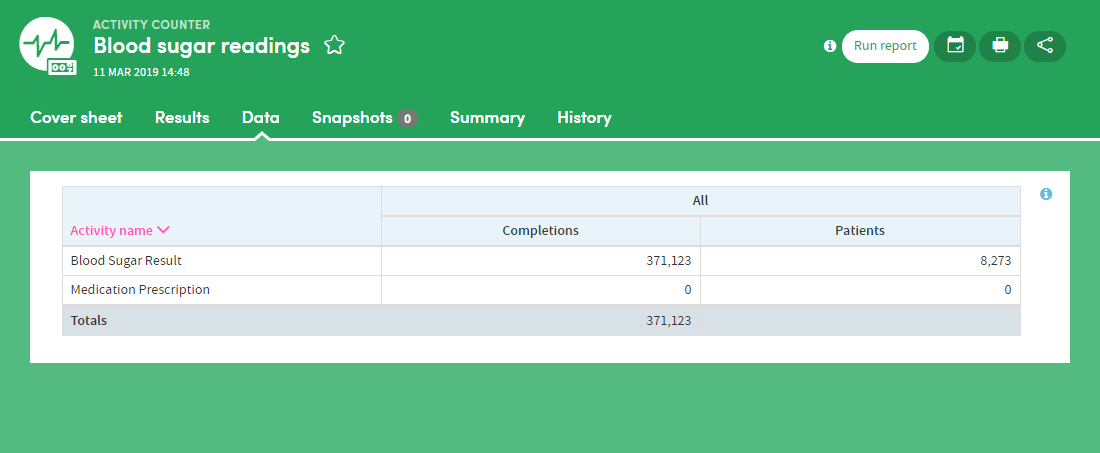
Some types of report include a Data section which presents the report data in tabular format, with features which enable in-depth sorting and analysis:
Summary tab
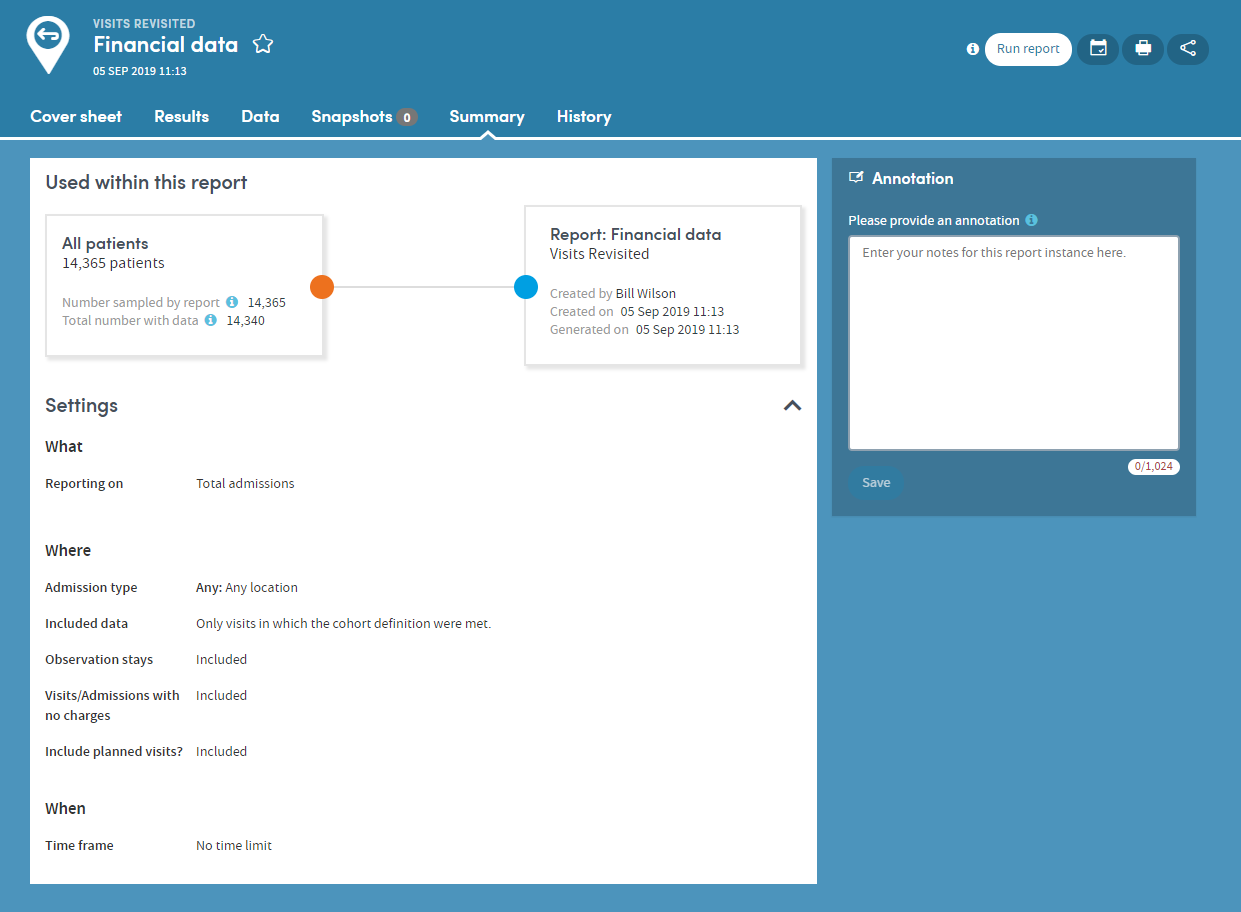
The Summary specifies all the options selected by the user who created the report. You can also add annotations to the Summary if you wish:
History tab
Every time a report is generated, it is saved and can be reviewed at any time. The History tab allows you to select and view any previous version of your report:
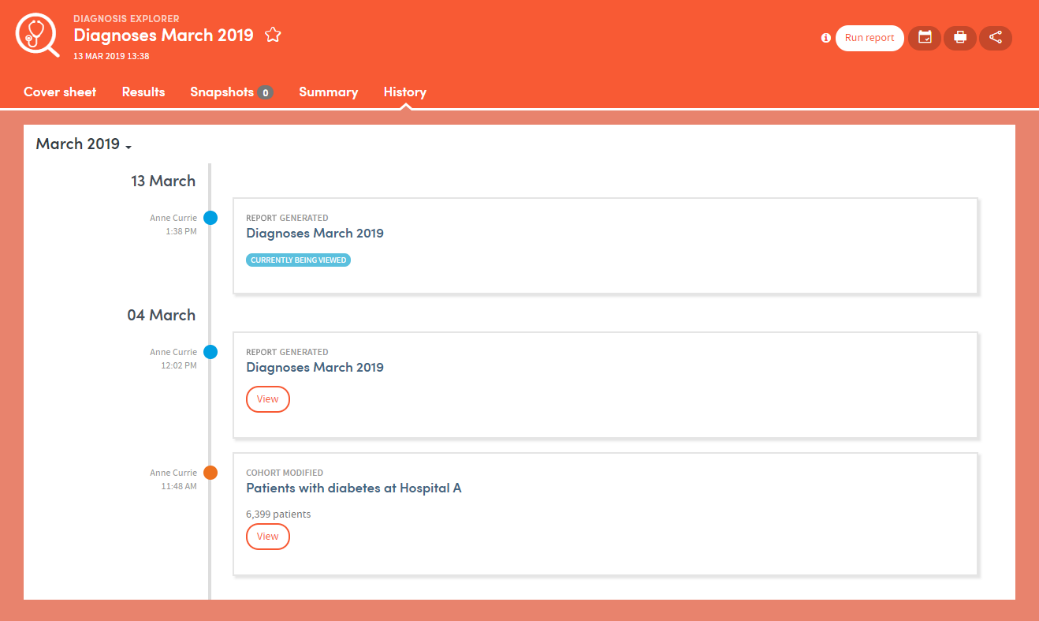
Click the View button to see previous versions of the report:
