- Home
 Atmoforms
-
Software
-
Patient records
-
Results procedures
-
TMI Dosimetric Data Processor
TMI Dosimetric Data Processor
This processor is intended for use with large data forms which have the Large Data Attachment question (i.e. the “Has graphable attachment” toggle in the form properties in Builder has been switched on).
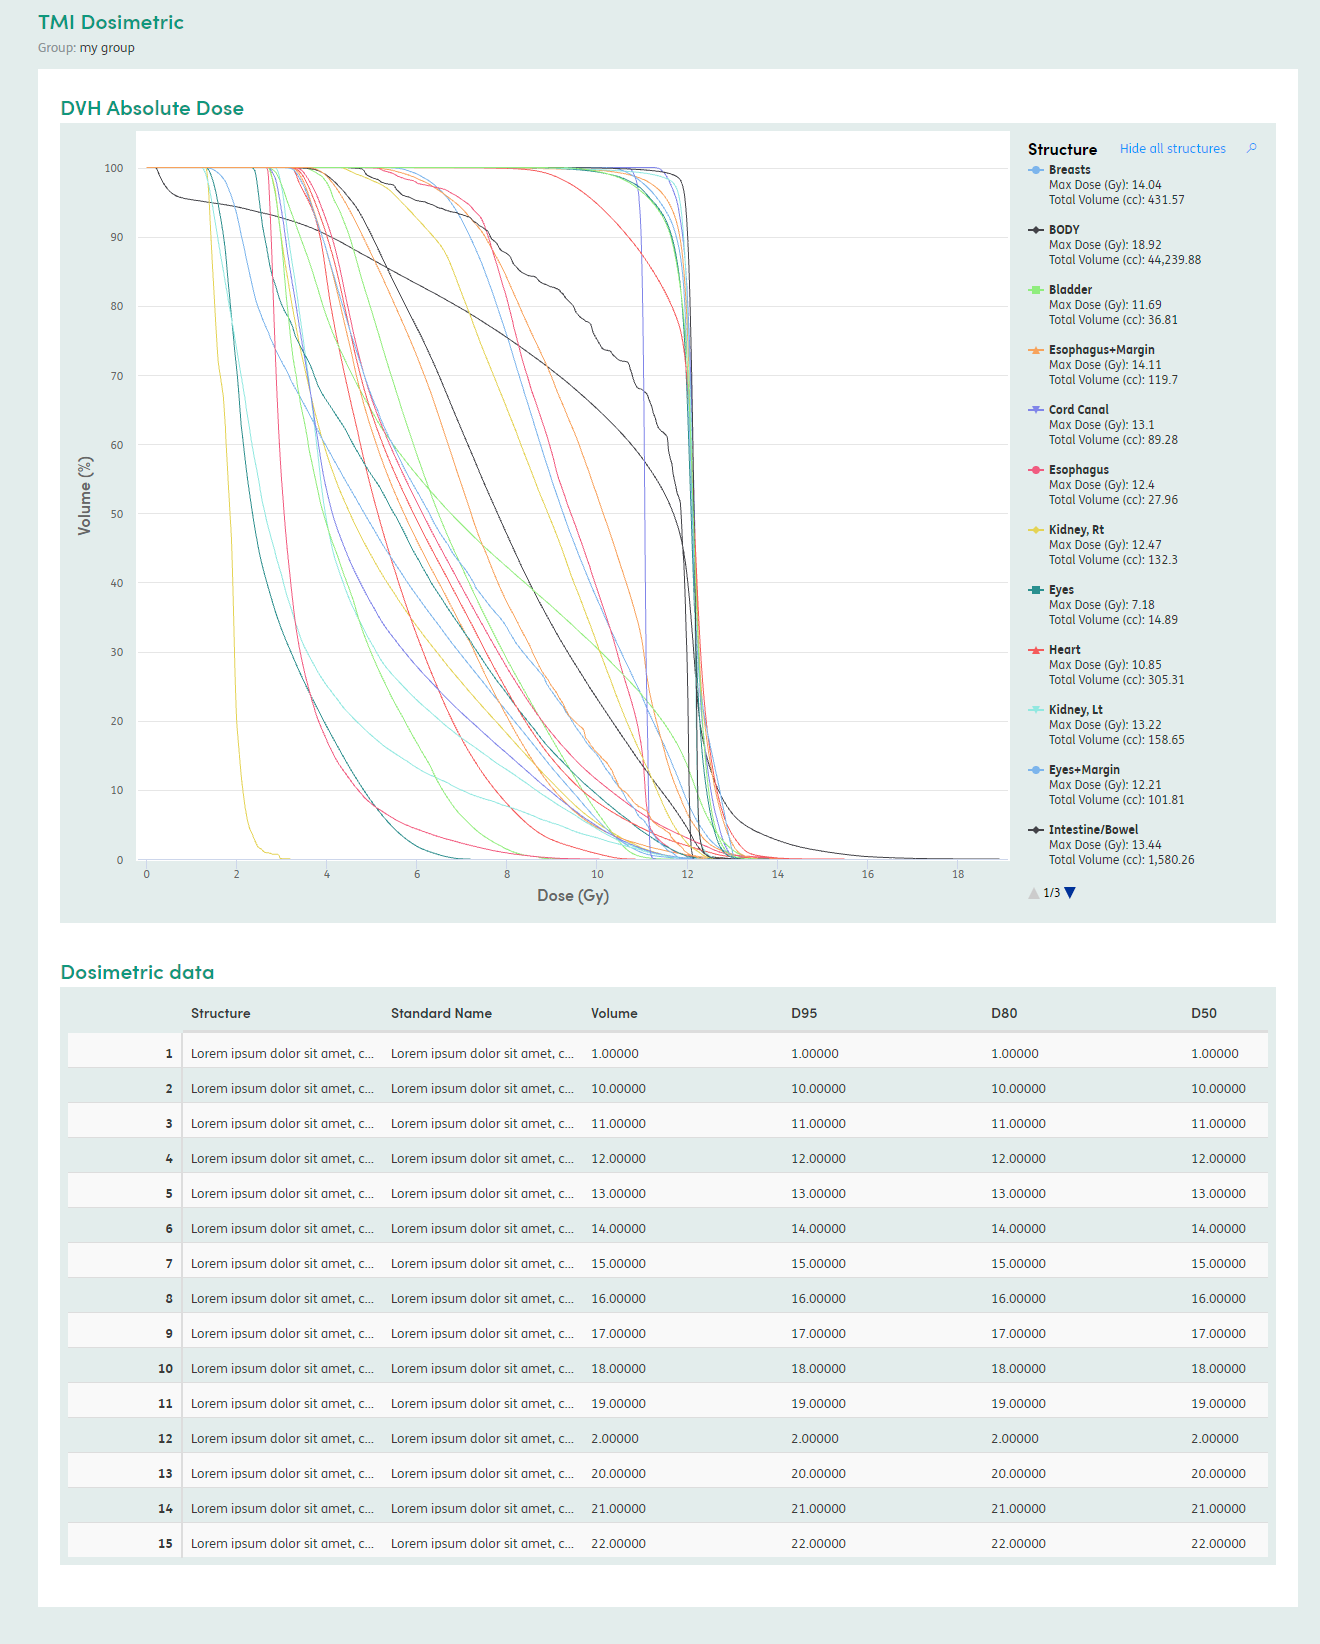
Each instance of the form will have a JSON attachment representing the series in a chart associated with that form instance. The grouped form instances will be shown in a single page with a chart at the top containing each of the JSON series, and a table underneath with the corresponding form instance data.
The series are colour coded, with a legend on the right hand side. The legend allows the user to see all the series at once (the default view), just one series at a time, or any combination of series at the same time.
You can move the cursor over the series to see a tooltip showing the values for the data point at that location. If you click and drag a box somewhere within the chart, you can zoom in and interrogate the data points more closely.