Redesign of the Insights
We have made significant changes to the Insights displayed within the Data Explorer tab. These are summarised below.
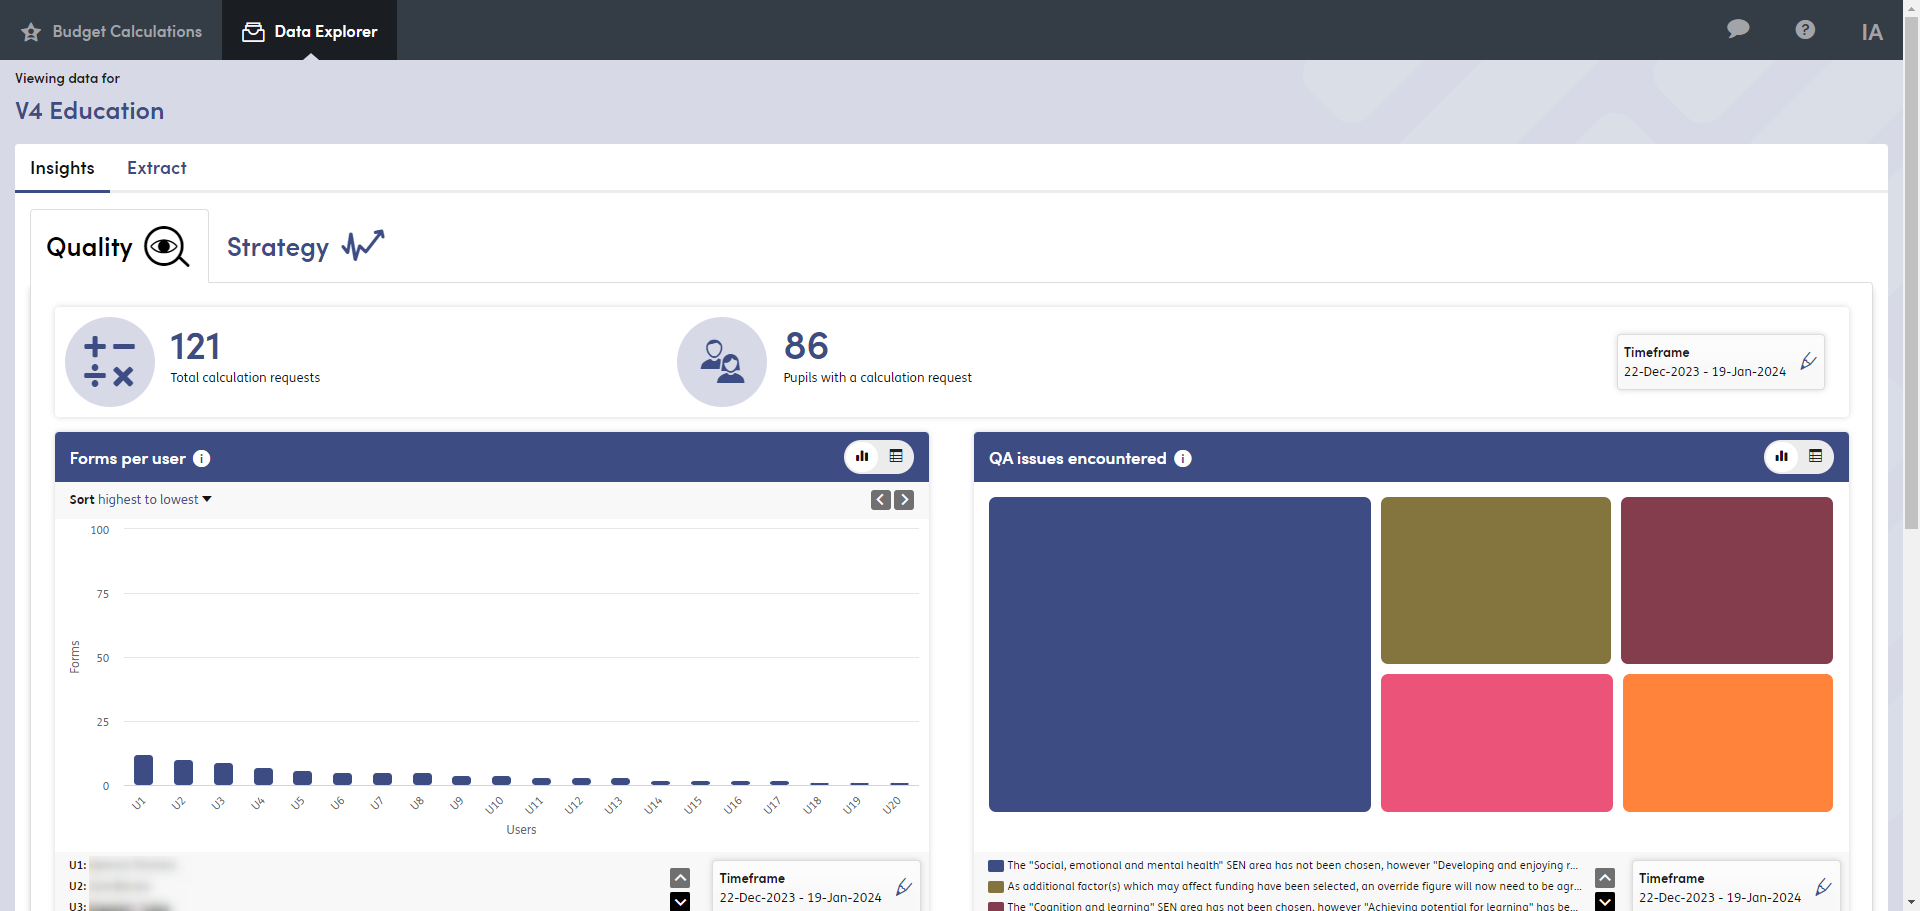
The Insights have been separated into three distinct categories: Quality, Strategy and Accuracy. Grouping the Insights in this way puts Insights of the same ‘type’ together so the insights are readily available for the relevant people - to help drive decision making and service improvements.
The three categories will display as tabs within the Data Explorer area, and you can select the tab heading to navigate between the different categories and view the relevant Insights.
- The Quality tab will show Insights related to the usage of Formulate - such as the number of forms completed, the number of calculations per form, and QA statements generated.
- The Strategy tab will show Insights with key information generated by Formulate, to help with strategic planning.
- The Accuracy tab will show Insights related to the accuracy of Formulate - such as comparisons between Actual and Estimated Budgets.
Quality
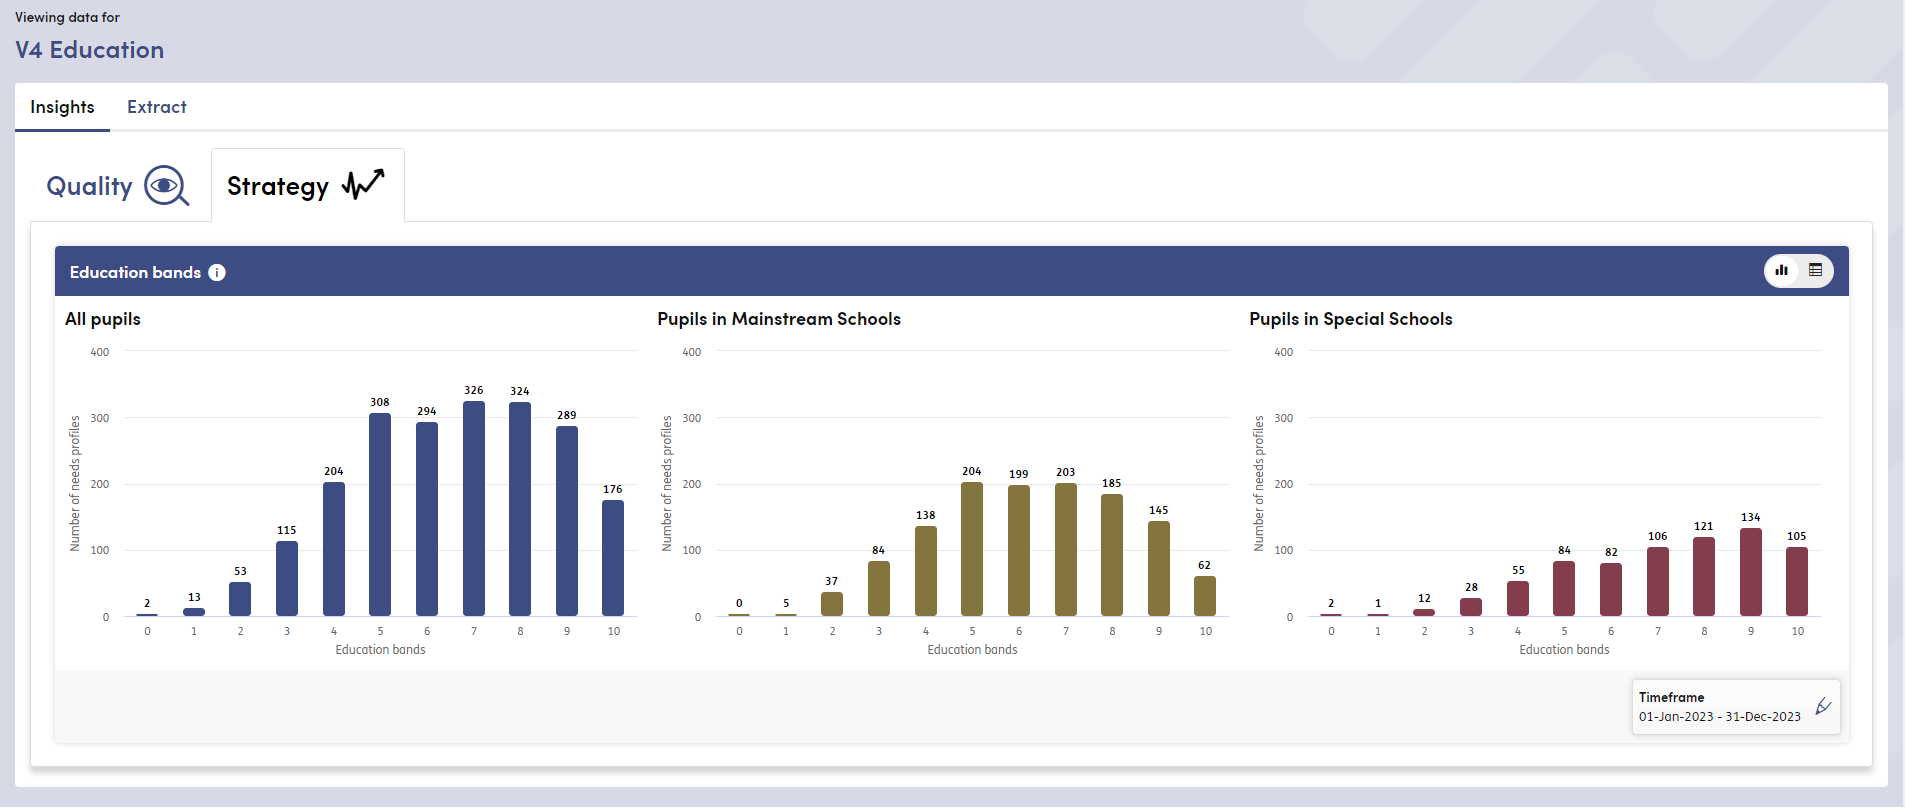
Strategy
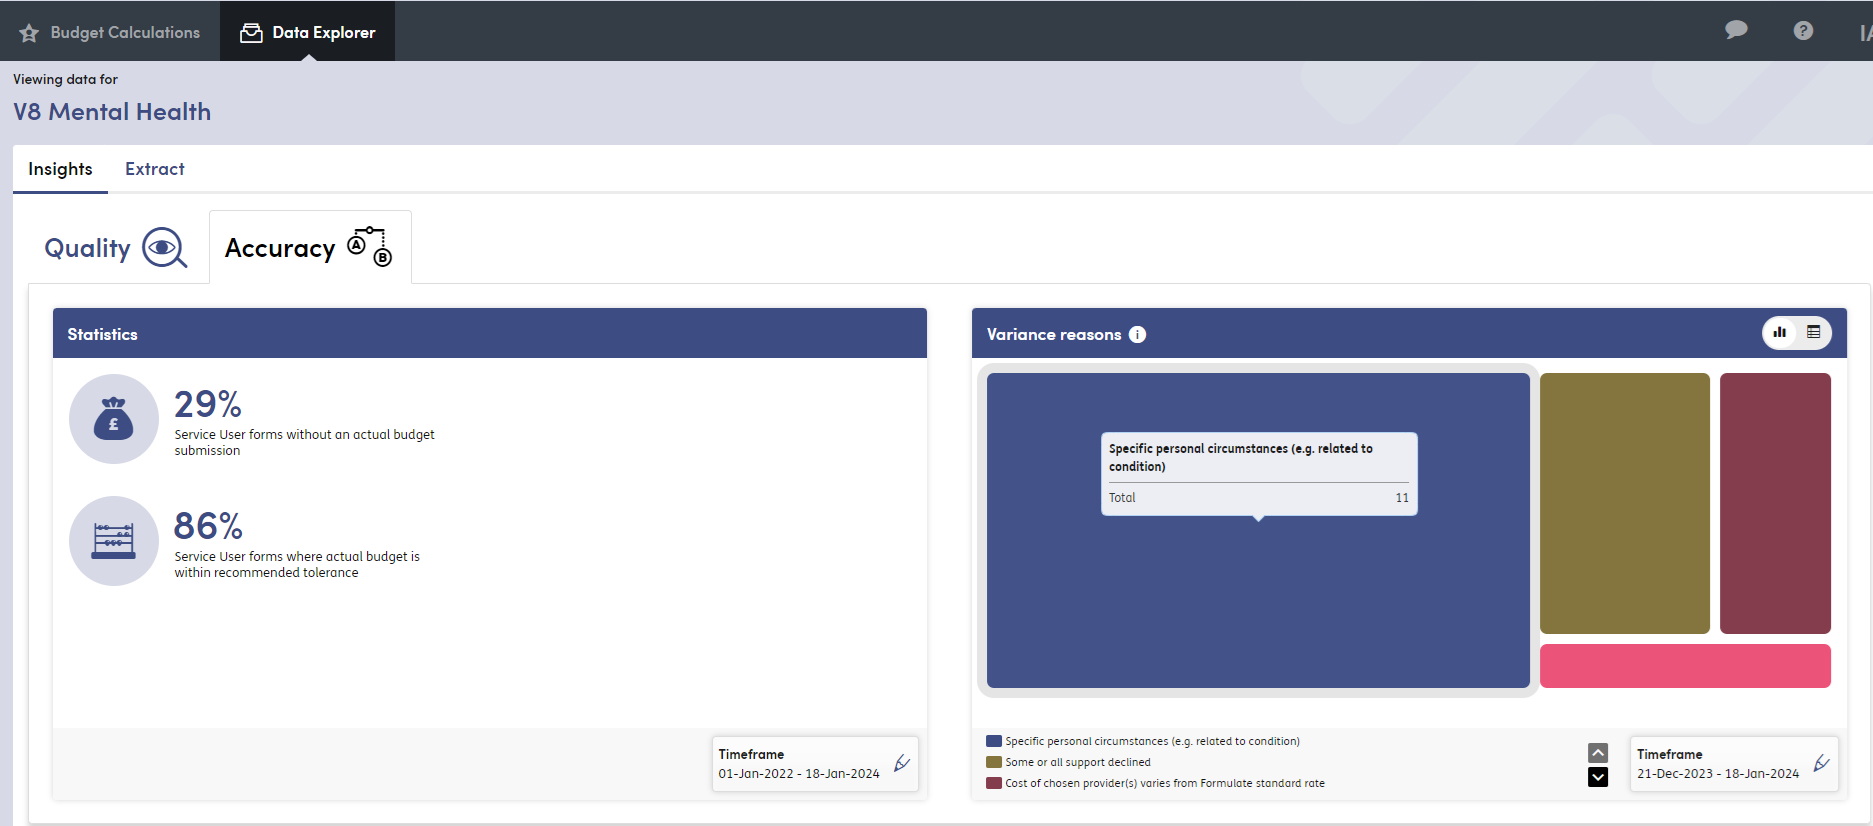
Accuracy
The categories available for your organisations are dependent on the below factors:
- The ‘Strategy’ tab is currently only available for organisations using Formulate for SEND, with plans to expand the Insights available in future releases.
- The ‘Accuracy’ tab will be hidden where the Actual Budgets functionality is disabled. Additionally, within this release, the tab will be hidden where the organisation is using Formulate for SEND. This is due to the use of weekly figures within the calculations, as opposed to annual. There are plans to support annual calculations for these Insights in future releases.
We have rationalised the time period filters - this will prevent any need for interpretation around time periods such as ‘the last month’, and removes the option of ‘all time’ (which can take a long time to generate). The Insights will now just be based on the from and to dates.
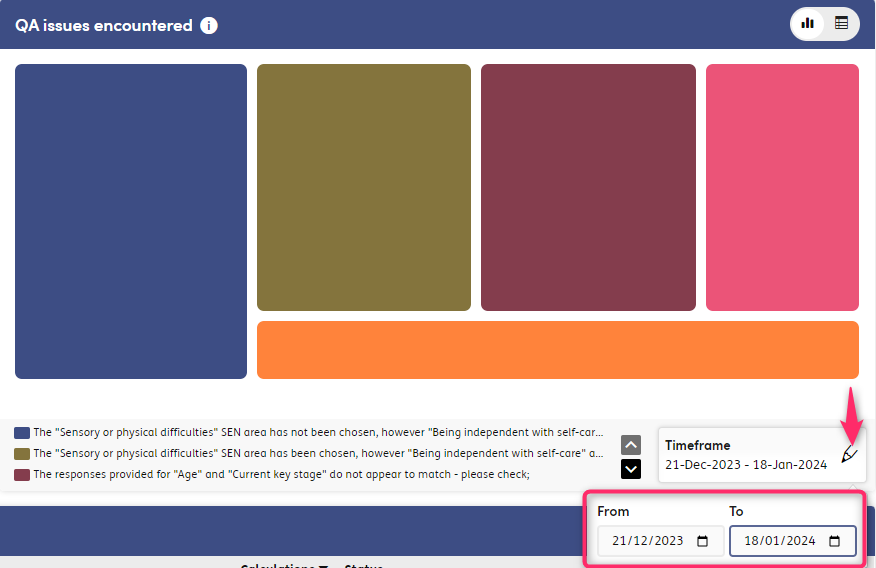
By default the Insights will load with the past 4 weeks of data from today’s date. The ‘from’ and ‘to’ dates can be amended - with data being calculated from 00:00 on the ‘from’ date up to 23:59 (or ‘now’) on the ‘to’ date. Verification will be carried out on the dates to ensure that only valid dates can be entered.
Additionally, the date range can now be toggled for each Insight - this will help with performance of the Insights tab, as it means that only a specific Insight needs to be reloaded when the date range is amended, rather than the full set of Insights.
We have redesigned some of the existing Insights:
QA issues encountered
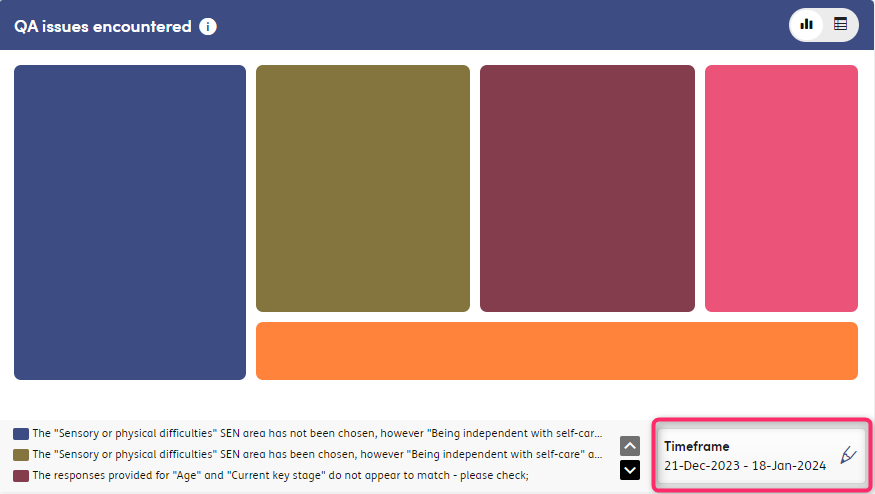
- This Insight was previously a bar chart - it is now a box chart, which provides a more visually accessible display of the QA issues which have been encountered. There is a key displayed below the chart which shows a snippet of text of the relevant QA issue for each area of the chart - hovering over the text snippet will display the full text for the statement. You can also hover over the chart areas to display the full text of the statement and the number of times it has been encountered within the specified time frame.
Forms per user
- This Insight previously showed the number of Formulate submissions per user. Our user research has highlighted that the most useful application of this Insight is to be able to understand caseloads across the teams - to be able to identify the volume of forms completed by each user, and thus identify potential superusers, or better understand the division of work within the teams. As such, we have changed the insight to display the number of forms per user.
Variance reasons
- Similarly to the QA issues Insight, the bar chart previously used here has been replaced with the more visual box chart. There is a key displayed below the chart which shows a snippet of text of the relevant variance reason for each area of the chart - hovering over the text snippet will display the full text for the statement. You can also hover over the chart areas to display the full text of the statement and the number of times it has been encountered within the specified time frame.
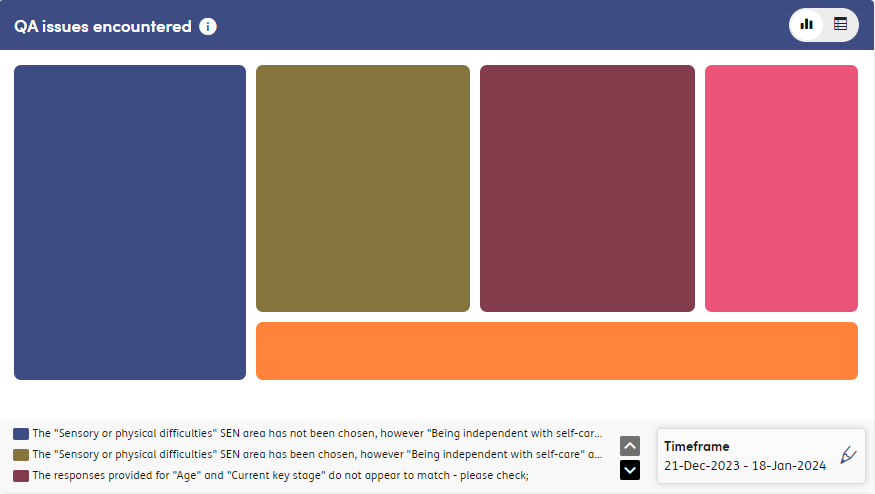
QA issues encountered
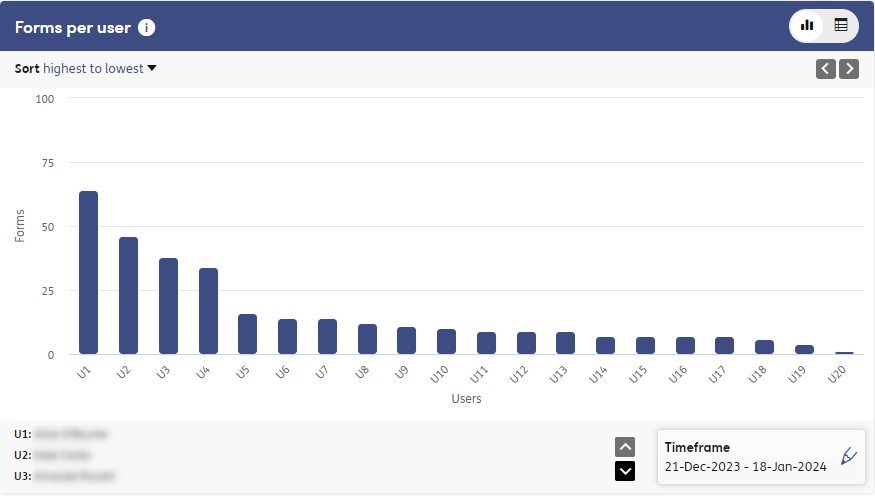
Forms per user
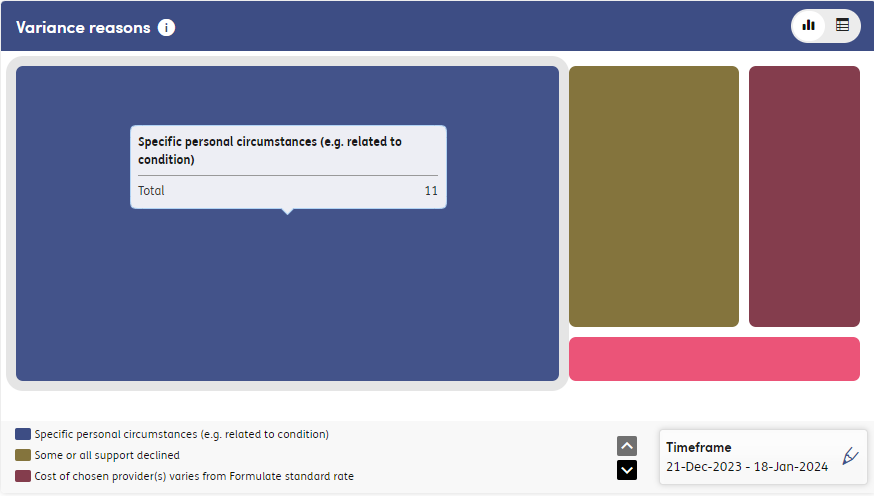
Variance reasons
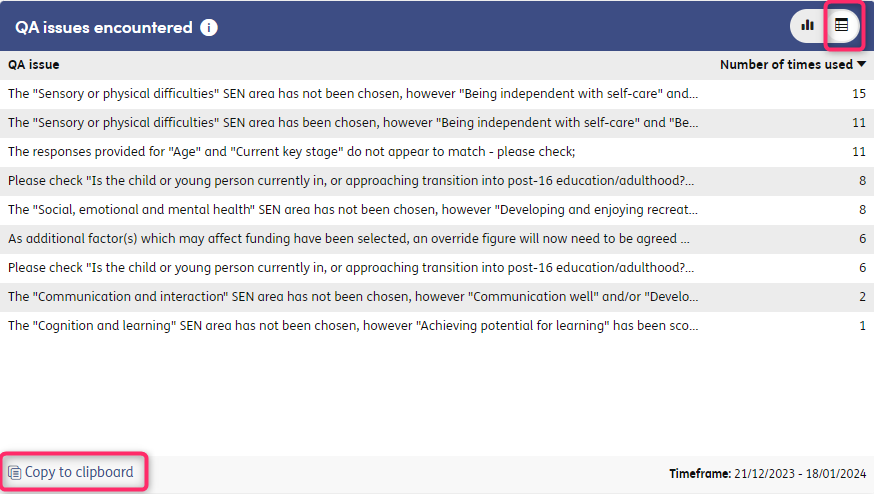
We have added a new ‘Data table’ view for all Insights. This will make the data more easily available for you to use in additional analysis.
To access the data table, select the toggle in the top right corner of the Insight. You can then use the ‘Copy to clipboard’ function to copy the data and paste it elsewhere, for example into Excel.
We have added a new Insight ‘Forms with three or more calculations’. This will display a table of all forms which have had three or more calculations.
This can be indicator that there has been a problem with the completion of the forms. Three calculations is used as the benchmark as you may expect to see two calculations if a form has returned QA statements and the user has corrected for these - three or more indicates continued changing of answers, and may highlight either a more complex case, a training issue or manipulation of the tool.

-
1
Identifier - the identifier for the individual
-
2
Opened on - the date and time the form was opened. If the form was completed within Formulate Portal, the date and time can be clicked and a link to the form instance will open in a new tab
-
3
Assessor - the name of the assessor who opened the form
-
4
Calculations - the number of calculations. This is automatically sorted highest to lowest.
-
5
Status - form status, whether this is In progress (and if so if it is Overdue) or Complete
-
6
Change from first to last - the monetary change for the estimated budget between the first and last calculation - and whether this is an increase or decrease (or remained the same).
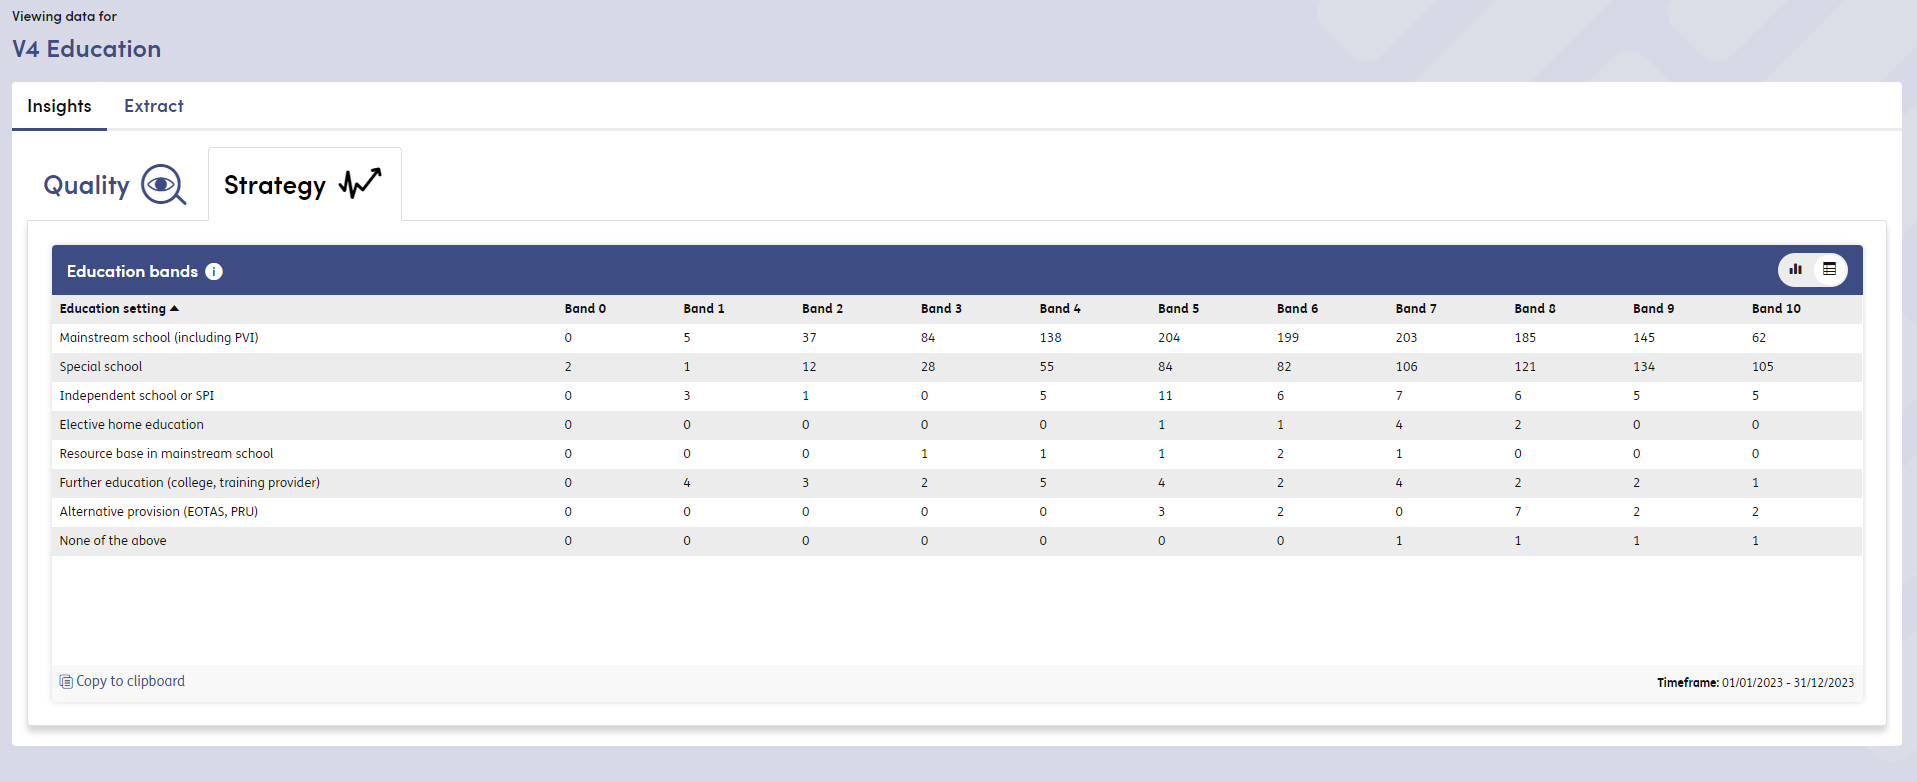
We have added a new Insight ‘Education Bands’ for organisations using Formulate for SEND.
This Insight is a trio of bar charts showing the number of children and young people within each Education Band, split across pupils in all education settings, those in Mainstream Schools and those in Special Schools. This will allow you to quickly see the spread of bands for your local area.
The tabular view for this chart will show a further breakdown of the Education Bands for all education settings.
Due to the extended scope of the Insights we have restricted access to the Data Explorer tab to users with Elevated Access.
