Data Insights
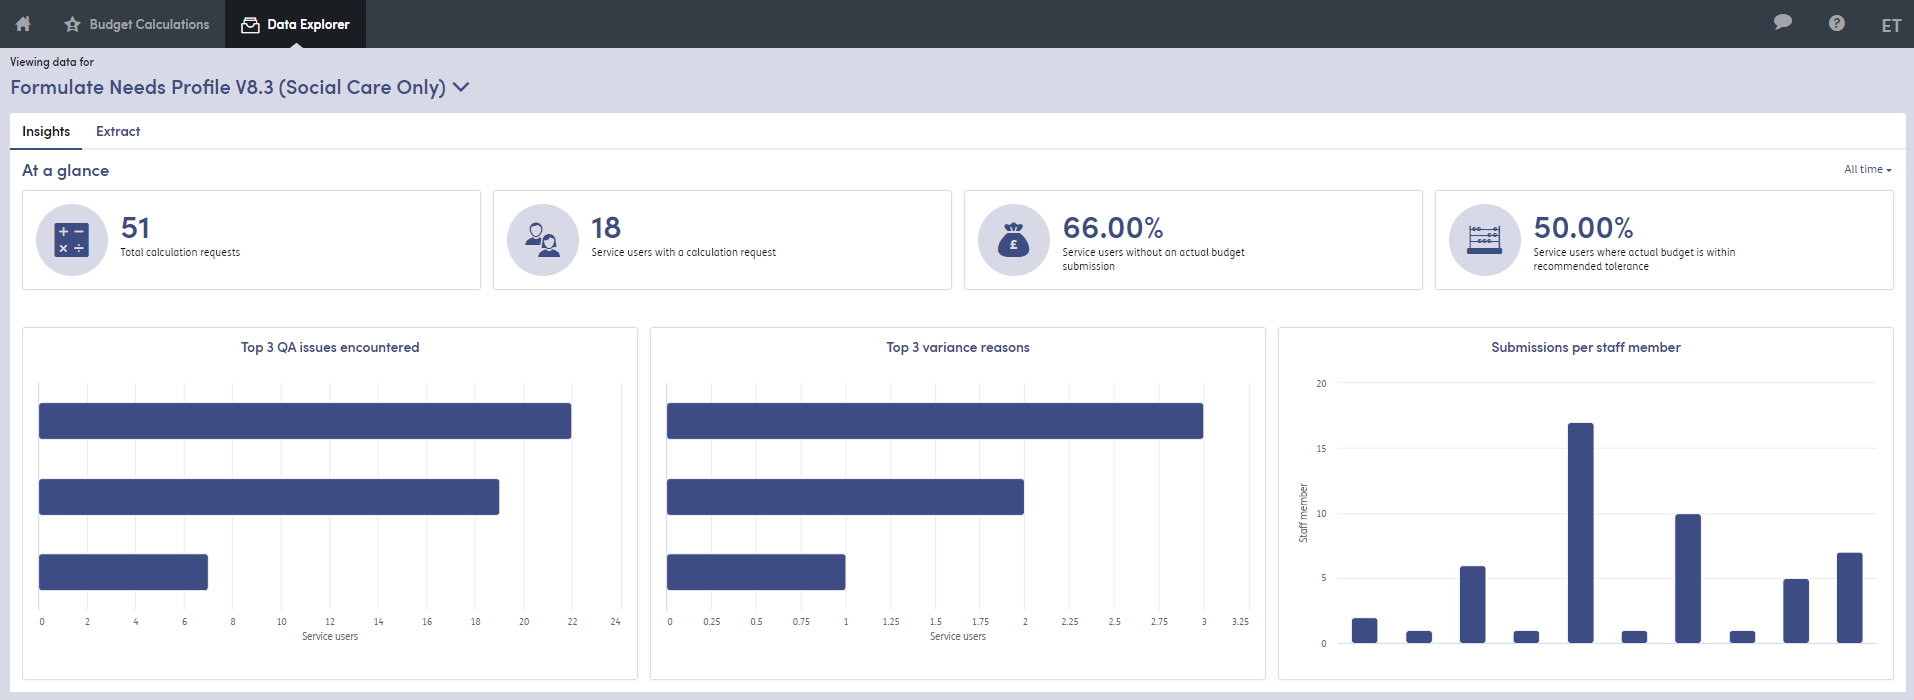
The ‘Insights’ tab gives users the ability to see, at-a-glance, key information relating to their submissions.

The following data points are available within this screen:
- Total calculation requests
- Service users with a calculation request
- Service users without an actual budget submission
- Service users where actual budget is within recommended tolerance
- Top 3 QA issues encountered
- Top 3 variance reasons
- Submissions per staff member
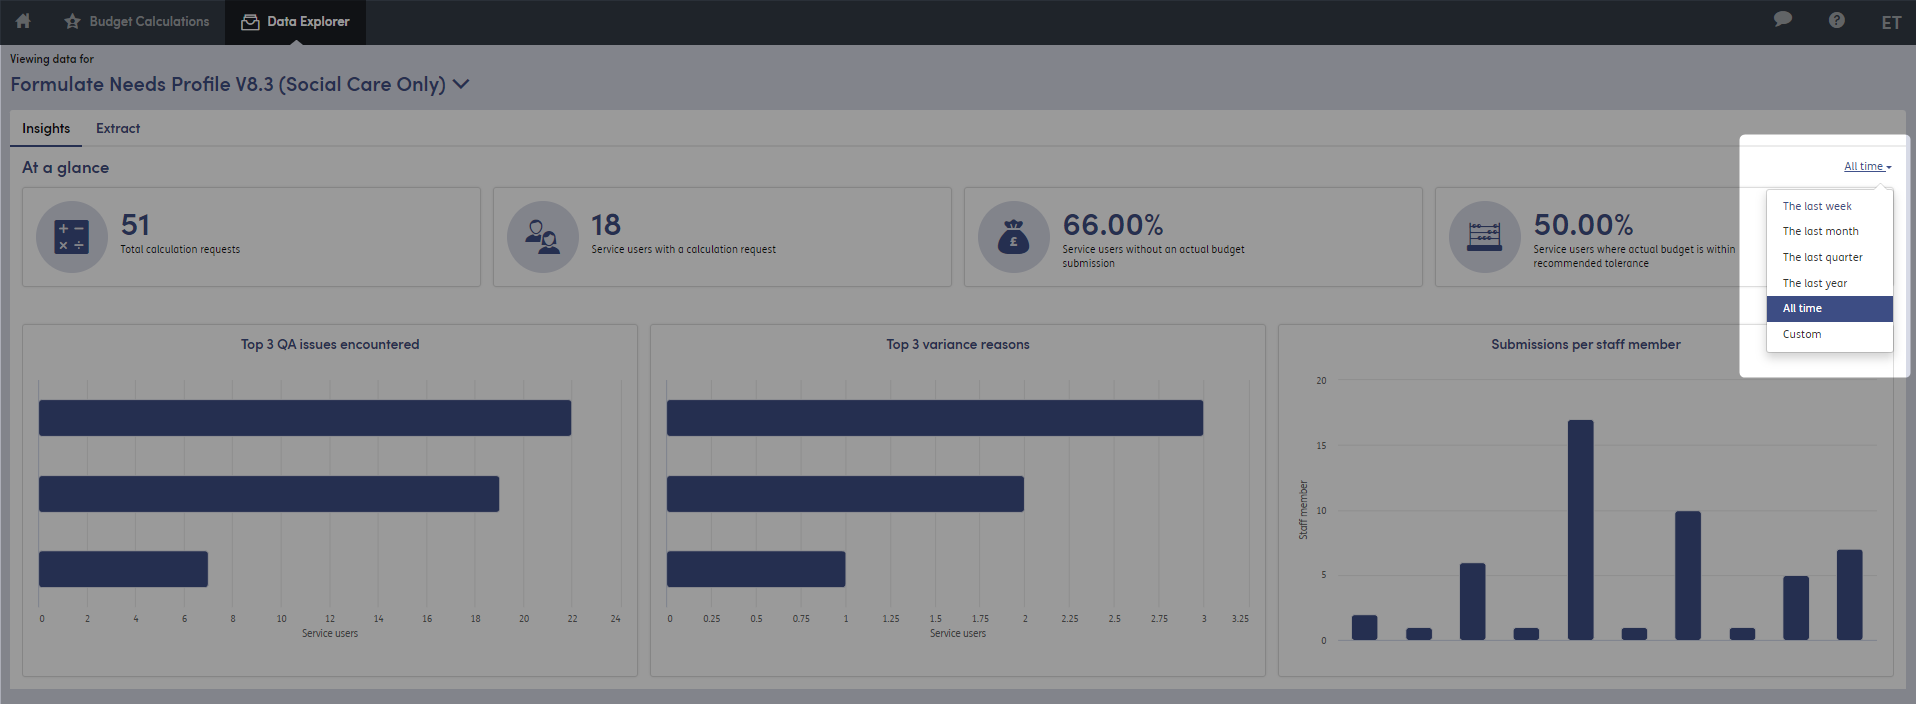
Users can choose which time period they wish to report on by changing the ‘The last week’ dropdown to a pre-defined time period.

If more than one form is being used within the system, users can choose which form they wish to view data for by clicking on the down arrow under ‘viewing data for’ at the top of the screen.
Please note:
we have added new functionality to this feature to include the staff name in the data explorer. This means for some historic Formulate submissions the staff name may not show in the insights or the exports.