Budget history - change over time view
In v2022.2.2 Users can now easily view how the budget has changed over time. In the event where there have been multiple calculation requests whilst the form is open, then detailed information regarding these calculations will now display to show the change in the budget calculations over time.
Chart view:
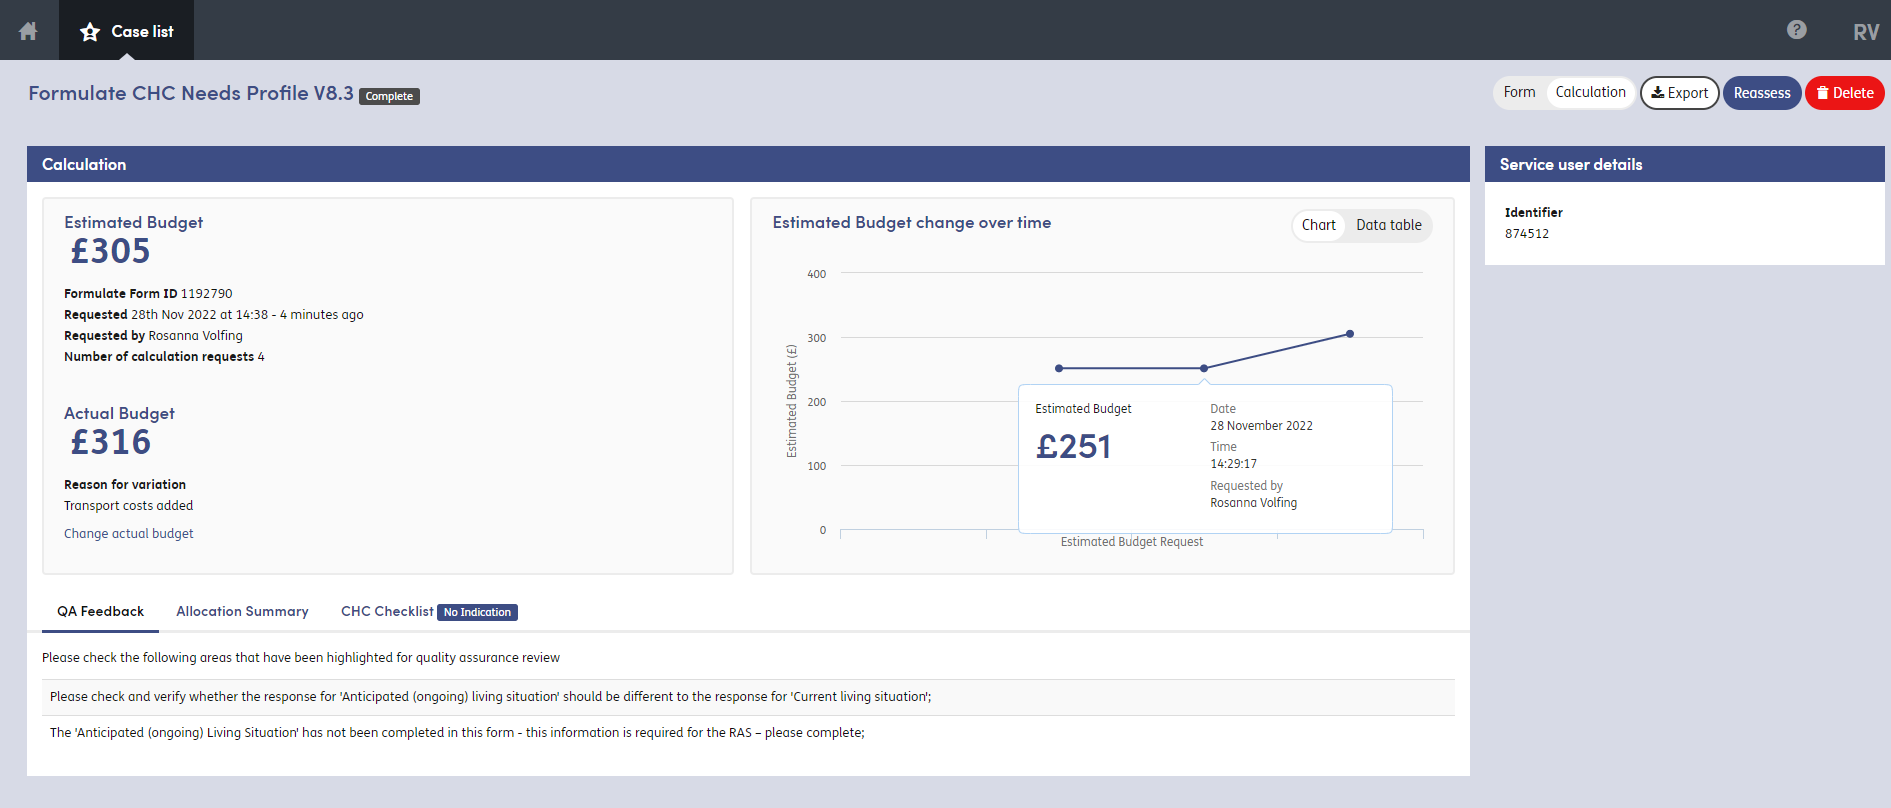
The default view for this information to display is in the ‘chart’ view. This will display a graph which provides a visual of how the Estimated Budget has changed over time.

The User can hover over the data points of the graph to see the following details:
- Estimated budget amount at time of request
- Date of calculation request
- Time of calculation request
- The name of the user that requested the calculation
Data table view:
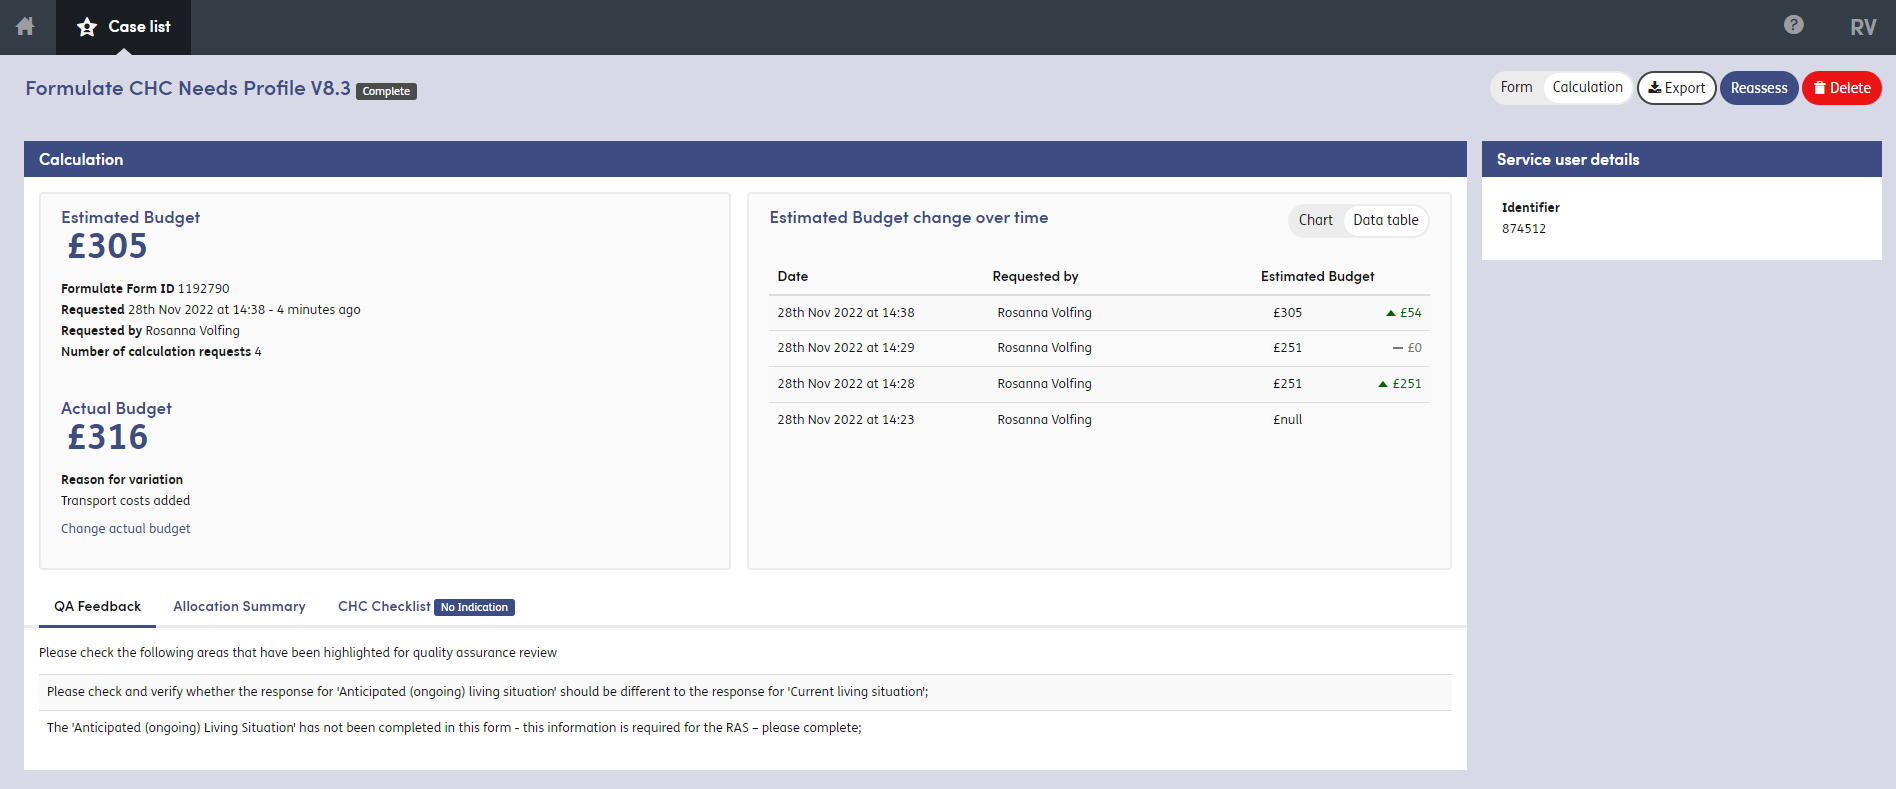
The User can also toggle the view of this to ‘Data table’ view using the toggle at the top of the graph.

The data table view provides the User with the same information but presented in a list. In this view, there is also additional information showing how much the Estimated Budget has changed over time.